SLIDE 7 1/31/2011 7
The Logic of Analysis of Variance cont.
- In more general terms, the
denominator of the F-ratio measures
- nly random and unsystematic
variability.
- For this reason, the denominator of
the F-ratio is called the error term.
- Definition: For ANOVA, the denominator of
the F-ratio is called the error term.
- The error term provides a measure of the
variance due to random, unsystematic differences.
- When the treatment effect is zero (Ho is true),
the error term measures the same sources of variance as the numerator of the F-ratio, so the value of the F-ratio is expected to be nearly equal to 1.00.
ANOVA Notation and Formulas
- Because ANOVA most often is used to
examine data from more than two treatment conditions (and more than two samples), we need a notational system to help keep track
- f all the individual scores and totals.
– 1. The letter k is used to identify the number of treatment conditions-that is, , the number of levels of the factor.
- For an independent-measures study,
k also specifies the number of separate samples.
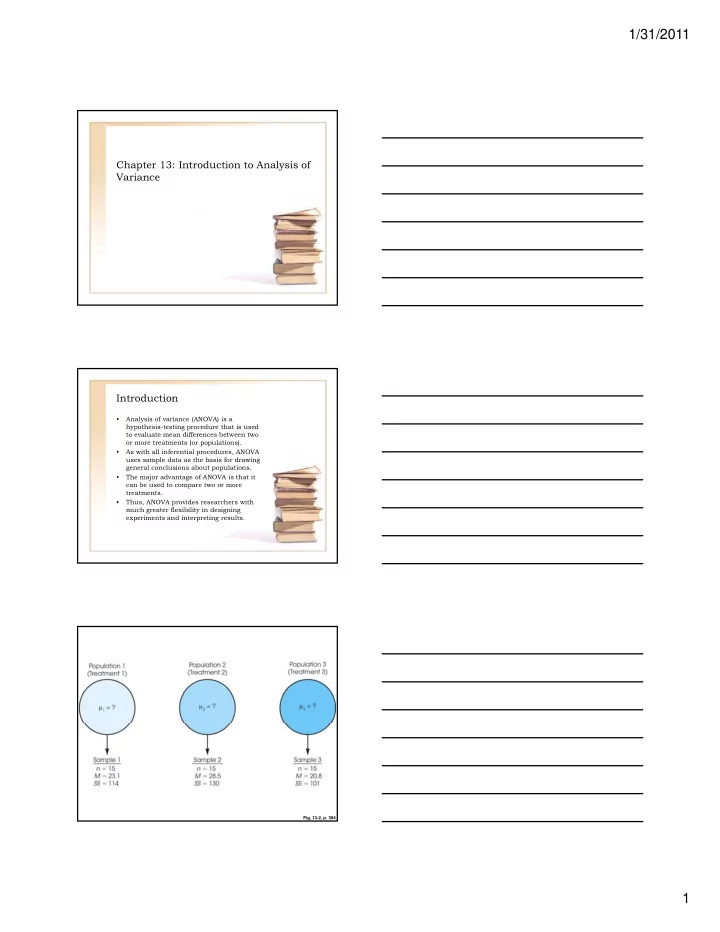
- For the data in Table 13,2, there are
three treatments, so k = 3. – 2. The number of scores in each treatment is identified by a lowercase letter n. For the example in Table 13,2, n = 5 for all the treatments.
ANOVA Notation and Formulas cont.
- If the samples are of different sizes,
you can identify a specific sample by using a subscript. – 3. The total number of scores in the entire study is specified by a capital letter N.
- When all the samples are the same
size (n is constant), N = kn.
- For the data in Table 13,2, there are
n = 5 scores in each of the k = 3 treatments, so we have a total of N = 3(5) = 15 scores in the entire study. – 4. The sum of the scores (∑X) for each treatment condition is identified by the capital letter T (for treatment total).