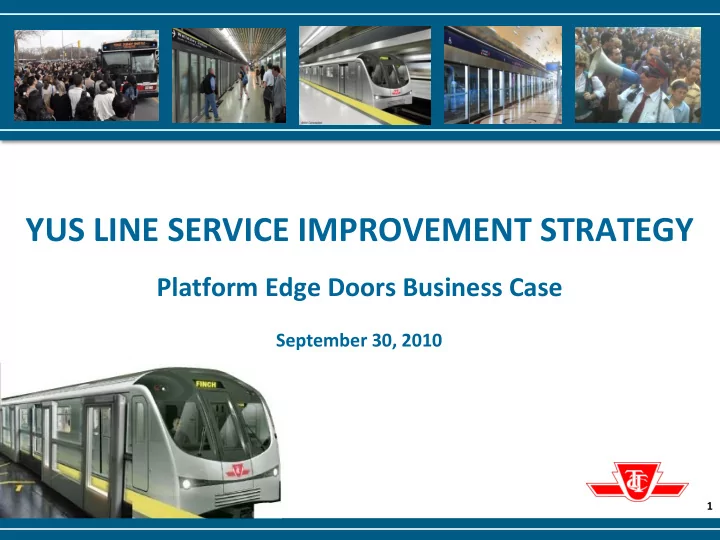

YUS LINE SERVICE IMPROVEMENT STRATEGY Platform Edge Doors Business Case September 30, 2010 1
Presentation Outline Introduction Service Improvement Strategy Platform Edge Doors (PEDs) Business Case Reliability/Capacity Improvement Summary/Recommendations 2
Introduction The YUS line is the most critical asset of the TTC: Provides 78% trips to the Central Business District Of TTC’s 1.5M riders each day, 700k use YUS Equivalent capacity of 5 DVPs Currently operating at a 10% shortfall in capacity 3
Introduction Toronto's commute times are a "glaring downfall" in the city's economic picture -- even worse than the notorious traffic snarls in Los Angeles, according to a new Board of Trade report. National Post, March 30, 2010 There is no capacity left in the GTA’s road and highway systems to address this challenge. 4
Service Improvement Strategy Current capacity is 26 trains/hour in peak Need to move to 35 trains/hour to meet required forecast capacity in 2030 How do we increase capacity and reliability? Move more trains per hour; currently constrained by signal system headway Train capacity More efficient use of trains interior space Longer trains Reliability, ensuring that the line is operated at peak capacity 5
NOVA’s International Benchmarking * Industry Best Practices Toronto will not achieve the target level of reliability through automation alone Even with TR and ATC, Toronto needs to reduce total incidents by 75% to achieve the target reliability level of 1 peak failure per week Toronto needs to target key areas first and then evaluate every aspect of the subway in terms of reliability * Presented by NOVA at the June 2, 2010 Commission Meeting 6
Reliability is Key Improvement Area 0.6 Million Car Kilometres Between Incidents Causing a Delay > 5 Minutes to Service (2008) 0.5 Key Areas for Improvement: 0.4 • New Rolling Stock • Modern Signalling and Train Control 0.3 • Management of trains in stations • Platform Edge Doors 0.2 TTC 0.1 0.0 Top 7 metros: Asia, South America Toronto #5 for Europe + North America To 7 7
PLATFORM EDGE DOORS (PEDs) 8
PEDs PEDs are commonly being installed around the world and are primarily used to: Maintain physical segregation between passengers waiting on the platform and the track. Prevent passengers from moving between the platform and the train unless the train is fully stationary in its correct position. 9
General PED Benefits/ Impacts Stakeholders Impacts Safety Improved Reliability Public Reduction in Noise Air quality Operation & Maintenance Staff stress and trauma TTC Perception of the TTC network Capital costs / Residual value 10
SYSTRA Deliverables Review of TTC’s Constructability Study of PEDs in our current stations Review of TTC’s cost estimates for PEDs in existing and new stations Business Case for the installation of PEDs 11
PED Business Case The Business Case is based on an analysis of the impacts for the community considering positive and negative impacts of an investment over the economic life of the project Two criterion were evaluated : Economic Net Present Value (ENPV) Economic Internal Rate of Return (EIRR) 12
PED Business Case Major Assumptions: 30 year benefit Ridership increase 1.5% per year Installation for the complete TTC network over 6 years Capital installation cost of $9.8M per station 13
Summary of Net Present Value • YUS + TYSSE Values in 2010 CAD • BD Discount rate at 8% • SHEPPARD M$ Economic Benefits 567.1 M$ Investments -511.6 M$ Economic Net Present Value 55.5 Notes : 1. Additionally, options of installing PEDs on individual lines was examined. As expected, due to the high passenger volume on the YUS, it provided the greatest return. 2. While not displayed, the Economic Internal Rate of Return exceeded the 8% set by the Treasury Board. 14
Sensitivity Analysis A sensitivity analysis was conducted with the following parameters: Capital cost PED O&M costs Rate of growth of GDP/capita Ridership forecast Value of severe/fatal injuries Value of time Analysis determined that NPV and EIRR remained favorable 15
Conclusion PED are necessary to achieve TTC performance objectives CBA gives a positive NPV and an EIRR > 8% PED installation a complex task, must be operation focused 16
SYSTRA Recommendations Install the PEDs which is a viable, economic and operational solution which would enhance the overall TTC operations Co-ordinate all new improvement as a whole to implement a global engineering approach Carry out detailed reconnaissance of sites Ensure installation plan is: Performance based schedule Efficient to minimize disruption to service Take advantage of the market situation 17
SYSTRA Recommendations (2) Mitigate risk through: – Managing scope creep – Identifying and managing interfaces – Tight controls on PED Supplier – Involving Operations Departments early in design and implementation process – Developing a prototype installation 18
Safety, Reliability and Environmental Benefits Benefit Safety Reliability Intentional and unintentional train contact Unauthorized at track level Debris and Fires Train Doors Environmental 19
Reliability Improvement 20
Reliability Improvement Reliability Million Car Kilometres Between Incidents Causing a Delay > 5 Minutes to Service (2008) 1.6 1.5 1.0 improved to top 0.6 4 European or Key Areas for Improvement: 0.5 • New Rolling Stock North American • Modern Signalling and Train Control 0.4 • Management of trains in stations • Platform Edge Doors property and 0.3 equivalent to 0.2 Asian properties TTC 0.1 0.0 Top 7 metros: Asia, South America Toronto #5 for Europe + North America To 21
Capacity Improvement Adopting these improvements creates the equivalent of another YUS branch This represents another 2 DVP equivalents 22
Summary Future transportation growth can only be achieved by Transit, not roads (2002 Official Plan) The YUS Line is the most critical Transit Asset The YUS Line requires TRs, ATC, PEDs and Station Managers to meet the capacity & reliability challenge These initiatives will provide Toronto with a World Class Subway 23
Recommendations Direct staff to continue with planning for PED installation Staff to include PEDs in 2011 – 2015 Capital Budget 24
Questions 25
Recommend
More recommend