
SLIDE 1
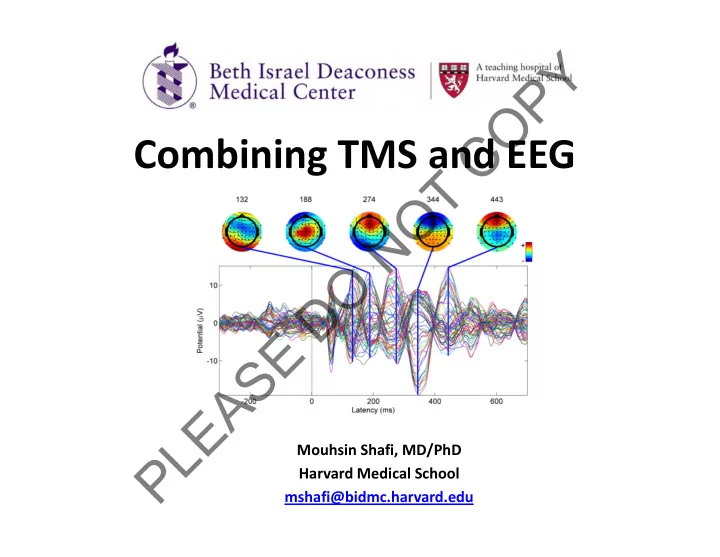
Combining TMS and EEG
Mouhsin Shafi, MD/PhD Harvard Medical School mshafi@bidmc.harvard.edu
Y P O C Combining TMS and EEG T O N O D E S A E L - - PowerPoint PPT Presentation
Y P O C Combining TMS and EEG T O N O D E S A E L Mouhsin Shafi, MD/PhD P Harvard Medical School mshafi@bidmc.harvard.edu Y Talk Overview P O Intro to TMS and EEG C Technical issues and challenges T O Neuroscience
Mouhsin Shafi, MD/PhD Harvard Medical School mshafi@bidmc.harvard.edu
neurologic and psychiatric diseases
Outcome Measures MEP Amplitude
Motor Responses MEPS
Amplitude (or Power) Frequency Phase # of Cycles/Second (Hz) Strength (µV or µV2) 10Hz 20Hz π (Radians)
Trial 1 Trial 2 Trial 100
Event/Stimulus
Time: Event Related Potential or Evoked potentials Frequency: Event Related Spectral Perturbation Phase
Frequency Domain
imag real
Phase
Xi (f)
1 2 3
‐ Amplitude/Power ‐ Frequency ‐ Phase
Spontaneous EEG: Spectral Power EEG + Event: Event‐Related Potentials (ERP or EP) Event‐Related Spectral Perturbation (ERSP) Event‐Related Synchronization (ERS) Event‐Related Desyncronization (ERD) 1 2 3
Direction of Information Flow Directed Transfer Function Directed Partial Coherence Cross‐Frequency Phase‐Amplitude Coupling Correlation (time) Coherence (frequency) Synchrony (phase‐locking)
Θ
M/F
M/F
Ives et al., 2006, Clinical Neurophysiology
TMS pulse generated too high a voltage (> 50mV) for most amplifiers to handle. Amplifiers were saturated or even damaged!
References: Vaniero et al, 2009; Ilmoniemi et al, 2010
analog digital converter (ADC) resolution (i.e., 24 nV/bit) compared to older 16‐bit ADC resolution that was limited to 6.1 mV/bit, and high sampling rate (20 kHz)=> capture the full shape of artifact and prevent amplifier clipping.
Virtanen et al., Med Biol Eng Comput, 1999;
nV/bit) and operational range of EEG amplifiers so that amplifiers would not saturate by large TMS voltage
Nexstim (Helsinki, Finland) BrainProducts (Munich, Germany) NeuroScan ( Compumedics )
reduce the gain for ‐50µs to 2.5 ms relative to TMS pulse.
avoid amplifier saturation; Artifact removed by finding the difference between two conditions.
Thut et al., 2003; Ives et al., 2006;
Reference: Pascual‐Leone et al., 1990, Lancet
One of the subjects had a burn on the skin, to test whether this had anything to do with rTMS, they placed electrodes on their arm and stimulated the electrode with different number of stimuli, different intensity and different duration of stimulation.
Temp ~ r2 Temp ~ B2 Temp ~ metal electrical conductivity (σ)
Virtanen et la., 1999
References: Vaniero 2009; Ilmoniemi 2010;
~ 100 dB 5 cm of the coil Air & Bone Conducted
Auditory masking with a frequency matched to the spectrum of the TMS click
Nikouline 1999 Massimini 2005
Frontalis Temporalis Occipitalis
Retrieved From: http://education.yahoo.com/referen ce/gray/illustrations/figure?id=378
Independent Component Analysis
Mutanen 2012
M/F
FZ OZ EOG1 EOG2 F3 F4
M/F
Results from: H. Sekiguchi et al., Clinical Neurophysiology Solution: Rearrange the lead wires relative to the coil orientation. ‐ Large positive depression after the stimulus onset for Base, C45, and CC45 directions, ‐ Residual artifacts were negligible at both 90 positions
Create a temporal template of TMS artifact and subtract it; Example: TMS only condition; TMS+Task Condition, then subtract TMS Only from TMS+Task
References: Thut et al. 2003; 2005. Interpolation: Cut the artifact and connect the prestimulus data point to artifact free post stimulus Refereces: Kahkonen et al. 2001; Fuggetta et al. 2005; Reichenbach et al. 2011. References: Litvak et al. 2007; Korhonen 2011 Hamidi 2010; Maki & Ilmoniemi 2011; Hernandez‐Pavon 2012; Braack 2013, Rogasch 2014 Parse out EEG recording into independent (ICA) or principle (PCA) components and remove the component that are due to noise; Non‐linear Kalman filter to account for TMS induced artifact References: Morbidi et al., 2007
Remove by setting the artifact to zero
References: Esser 2006; Van Der Werf and Paus 2006; Huber 2008; Farzan 2010;
M/F
Rogasch et al, NeuroImage 2014: Used ICA to remove components that are likely muscle and decay artifacts related to stimulation
**Clean**
Raw Slow Decay Blink AEP Bad electrodes
Significantly Different from Clean
Rogasch et al., NeuroImage, 2014
M/F
Step‐by‐Step Guideline
Farzan 2016 Frontiers Neural Circuits
Farzan 2016 Frontiers Neural Circuits
Farzan 2016 Frontiers Neural Circuits
Stimulation (input) Recording (output) Concurrently Stimulate & Record Adjust Stimulation Parameters Based on the Recording
Manual Adjustment
Advanced Technology Neuroscience Clinical Application
In 1989, Cracco et al., examined transcallosal responses by applying TMS to one side and recording EEG from the other side
Cracco et al., 1989, Electroencephalogr Clin Neurophysiol
Artifact reduced by adjusting the arrangement between the coil and the electrode and placing a steel strip ground electrode in between the coil and the recording electrodes
Ilmomiemi et al., Neuroreport 1997
Komssi, Human Brain Mapping, 2004 Other Earlier or Later References: Paus 2001; Komssi, 2002; Ferreri 2010;
Maki & Ilmoniemi 2010
P30 N100
TMS Pulse
The N15‐P30 correlated with the amplitude of MEP at the periphery N100 may be related to Inhibitory mechanism Bender et al., 2005; Bonato et al., 2006 Farzan et al., 2013
Potentials produced by DLPFC stimulation are correlated with, but smaller than, potentials produced by motor cortex stimulation. Motor cortex TEPs increase faster with higher intensity of stimulation than DLPFC TEPs
Kahkonen 2004
Komissi et al, Human Brain Mapping, 2004 Kahkonen 2005
Massimini 2005
Power of spontaneous alpha oscillations in the sensorimotor cortex immediately prior to administration
TMS is negatively correlated with TMS‐evoked MEP amplitudes (Sauseng 2009; Zarkowski 2006) The amplitude and phase of the mid‐ range beta oscillations recorded distally
subsequent TMS‐evoked MEP amplitudes (Maki & Ilmoniemi 2010)
Predict: Behavior & Motor Response, or EEG Response
M/F
Rosanova et al, JNeuroscience, 2009
Alpha in Occipital Beta in Parietal Beta and Gamma in Frontal
Canali 2015 J Affective Do
M/F
Prefrontal Cortex Motor Cortex
Daskalakis 2008
Rogasch 2015 Cortex
M/F
Esser 2006: Following, 5 Hz rTMS to motor cortex, a potentiation
Vernet 2012: TMS‐evoked theta and alpha
cTBS, while TMS‐evoked beta activity
state beta power after cTBS
Shafi 2014: cTBS produced distributed frequency‐specific changes in network connectivity, resulting in shifts in network topology and graph‐theoretic metrics with implications for brain information processing
Gedankian et al, in preparation
M/F
Massimini 2005 Ferrarelli 2010
M/F
Morishima 2009: TMS applied to FEF during performance of a visual discrimination task for motion direction or visual gender.
M/F
See also: Sauseng 2009, Romei 2010
Thut 2011: Showed that alpha‐TMS targeted to the source of EEG alpha activity can upregulate the targeted alpha‐oscillations in the attention network Klimesch 2003: Showed that rTMS at individual alpha frequency to frontal and parietal sites led to significant improvement in mental
present at other frequencies
M/F
Vink et al, in preparation
M/F
M/F
Reference(s): Farzan 2010; Maki 2010 & 2011; Ferreri 2011
Reference(s): Lioumis 2009; Farzan 2010; Casarotto 2010
M/F
Farzan 2010
100ms
M/F
Lioumis et al., 2009 Retest after one week A high overall reproducibility (r > 0.80) was
M/F
Decreased complexity of evoked response in subjects with loss of consciousness due to any etiology, and in patients with vegetative versus minimally conscious versus locked‐in states
Casali 2013
M/F
Identified a threshold PCI of 0.31 that differentiated between conscious and unconscious individuals
Casarotto 2016 Ann Neurol
response, 21 with subthreshold PCI, and 9 with suprathreshold PCI
Casarotto 2016 Ann Neurol
Farzan 2010 Brain
NO difference in EMG measure of LICI. Only selective deficit when LICI measured for gamma oscillations in the DLPFC . Increased delayed activity with motor cortex stimulation in schizophrenia patients versus healthy subjects
Other TMS‐EEG in SCZ: Ferrerali 2009
Fransteva 2014 Cer Cortex
M/F
Increase in delayed evoked activity in patients with active epilepsy as compared to controls. Abnormal delayed activity is more prominent in regions with functional connectivity to regions of abnormal cortical development
Shafi, 2015 Ann Neurol
Sources of abnormal delayed activity (A, B) spatially colocalized with interictal discharge (C, E) and seizure onset zones (D,F) even though stimulation site was far away (red dot in above figure) Shafi 2015 Ann Neurol
Selection of Location of Stimulation Target
Titration of strength, frequency or length of stimulation
(depression)
Massimini 2007)
Timing of delivery of TMS stimulation
stimulation is more likely to achieve a specific result (Romei 2008, Sauseng 2009)
2010; Dugue 2011) Identification of subjects
Duration of stimulation
M/F
M/F
VanHaerents et al, Clin Neurphys 2015
VanHaerents et al, Clin Neurphys 2015
Tinnitus Patients Controls Wang 2015 PLOS One
Leuchter 2015 Br Stim
M/F
Farzan 2016 Frontiers Neural Circuits
M/F