Working with FreeSurfer Regions-of-Interest (ROIs) Outline - - PowerPoint PPT Presentation

working with freesurfer regions of interest rois outline
SMART_READER_LITE
LIVE PREVIEW

Working with FreeSurfer Regions-of-Interest (ROIs) Outline - - PowerPoint PPT Presentation

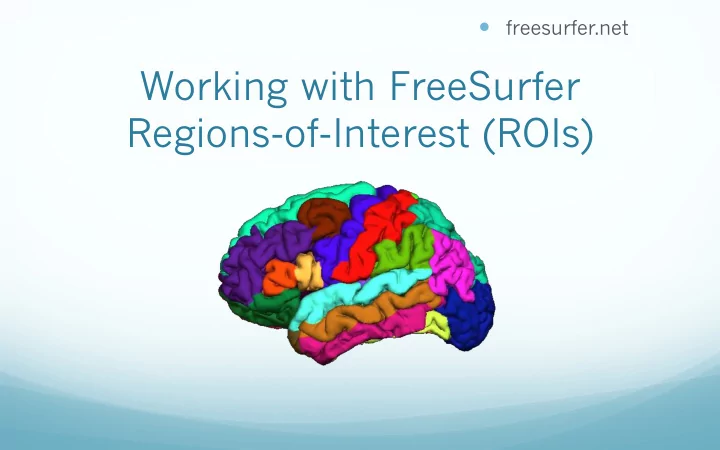
freesurfer.net Working with FreeSurfer Regions-of-Interest (ROIs) Outline Subcortical Segmentation Cortical Parcellation WM Segmentation Preparation/Analysis of Stats FreeSurfer ROI Terminology ROI = Region Of


slide-1
SLIDE 1

Working with FreeSurfer Regions-of-Interest (ROIs)

— freesurfer.net

slide-2
SLIDE 2

Outline

— Subcortical Segmentation — Cortical Parcellation — WM Segmentation — Preparation/Analysis of Stats

slide-3
SLIDE 3

FreeSurfer ROI Terminology

ROI = Region Of Interest Volume/Image (Subcortical): — Segmentation Surface (Cortical): — Parcellation/Annotation — Clusters, Masks (from sig.mgh, fMRI) — Label you created

slide-4
SLIDE 4

SUBCORTICAL AUTOMATIC SEGMENTATION (aseg)

slide-5
SLIDE 5

ROI Volume Study

Lateral Ventricular Volume (left)(Percent of Intracranial Volume)

Healthy Probable ¡AD Did ¡NOT ¡convert Did ¡convert

Fischl, et al, 2002, Neuron

slide-6
SLIDE 6

Segmentation

— Volume (for surfaces: “surface segmentation”) — Volume-style format (mgz, nii, nii.gz) — Each voxel has one index (number ID) — Index List found in color lookup table (LUT)

— $FREESUFER_HOME/FreeSurferColorLUT.txt

17 Left-Hippocampus 220 216 20 0 Index = 17 Name = Left-Hippocampus Red=220, Green=216, Blue=20 (out of 255) alpha = 0 (not really used)

— aseg.mgz, aparc+aseg.mgz, wmparc.mgz

slide-7
SLIDE 7

Subcortical Segmentation (aseg)

Caudate Pallidum Putamen Amygdala Hippocampus Lateral Ventricle Thalamus White Matter Cortex (not used)

Not Shown: Nucleus Accumbens Cerebellum

subject mri aseg.mgz

Whole Brain Segmentation: Automated Labeling of Neuroanatomical Structures in the Human Brain, Fischl et al. (2002). Neuron, 33:341-355.

slide-8
SLIDE 8

Volumetric Segmentation Atlas Description

  • 39 Subjects
  • 14 Male, 25 Female
  • Ages 18-87

– Young (18-22): 10 – Mid (40-60): 10 – Old Healthy (69+): 8 – Old Alzheimer's (68+): 11

  • Siemens 1.5T Vision (Wash U)

Whole Brain Segmentation: Automated Labeling of Neuroanatomical Structures in the Human Brain, Fischl et al. (2002). Neuron, 33:341-355.

slide-9
SLIDE 9

FreeSurfer Stats Outputs

SUBJECTS_DIR subject1 subject2 subject3 … mri label stats aseg.stats – subcortical volumetric stats created by mri_segstats

slide-10
SLIDE 10

aseg.stats

Index SegId NVoxels Volume_mm3 StructName Mean StdDev Min Max Range 1 4 5855 5855.0 Left-Lateral-Ventricle 37.7920 10.9705 20.0000 88.0000 68.0000 2 5 245 245.0 Left-Inf-Lat-Vent 56.4091 9.5906 26.0000 79.0000 53.0000 3 7 16357 16357.0 Left-Cerebellum-White-Matter 91.2850 4.8989 49.0000 106.0000 57.0000 4 8 60367 60367.0 Left-Cerebellum-Cortex 76.3620 9.5724 26.0000 135.0000 109.0000 5 10 7460 7460.0 Left-Thalamus-Proper 91.3778 7.4668 43.0000 108.0000 65.0000 6 11 3133 3133.0 Left-Caudate 78.5801 8.2886 42.0000 107.0000 65.0000 7 12 5521 5521.0 Left-Putamen 86.9680 5.5752 66.0000 106.0000 40.0000 8 13 1816 1816.0 Left-Pallidum 97.7162 3.4302 79.0000 106.0000 27.0000 9 14 852 852.0 3rd-Ventricle 41.9007 11.8230 22.0000 69.0000 47.0000 10 15 1820 1820.0 4th-Ventricle 39.7053 10.6407 20.0000 76.0000 56.0000 11 16 25647 25647.0 Brain-Stem 85.2103 8.2819 38.0000 106.0000 68.0000 12 17 4467 4467.0 Left-Hippocampus 77.6346 7.5845 45.0000 107.0000 62.0000 13 18 1668 1668.0 Left-Amygdala 74.5104 5.8320 50.0000 94.0000 44.0000 14 24 1595 1595.0 CSF 52.1348 11.6113 29.0000 87.0000 58.0000

Index: nth Segmentation in stats file SegId: index into lookup table NVoxels: number of Voxels in segmentation StructName: name of structure from LUT Mean/StdDev/Min/Max/Range: intensity across ROI

slide-11
SLIDE 11

aseg.stats Global Measures:

Cortical, Gray, White, Intracranial Volumes

Also in aseg.stats header:

# Measure lhCortex, lhCortexVol, Left hemisphere cortical gray matter volume, 192176.447567, mm^3 # Measure rhCortex, rhCortexVol, Right hemisphere cortical gray matter volume, 194153.9526, mm^3 # Measure Cortex, CortexVol, Total cortical gray matter volume, 386330.400185, mm^3 # Measure lhCorticalWhiteMatter, lhCorticalWhiteMatterVol, Left hemisphere cortical white matter volume, 217372.890625, mm^3 # Measure rhCorticalWhiteMatter, rhCorticalWhiteMatterVol, Right hemisphere cortical white matter volume, 219048.187500, mm^3 # Measure CorticalWhiteMatter, CorticalWhiteMatterVol, Total cortical white matter volume, 436421.078125, mm^3 # Measure SubCortGray, SubCortGrayVol, Subcortical gray matter volume, 182006.000000, mm^3 # Measure TotalGray, TotalGrayVol, Total gray matter volume, 568336.400185, mm^3 # Measure SupraTentorial, SupraTentorialVol, Supratentorial volume, 939646.861571, mm^3 # Measure IntraCranialVol, ICV, Intracranial Volume, 1495162.656130, mm^3

lhCortex, rhCortex, Cortex: surface-based cortical gray matter volume lhCorticalWhiteMater, … : surface-based cortical white matter volume SubCortGray: volume-based measure of subcortical gray matter TotalGray: Cortex + Subcortical gray IntraCranialVol: Estimated Total Intracranial vol (eTIV) http://surfer.nmr.mgh.harvard.edu/fswiki/eTIV http://freesurfer.net/fswiki/MorphometryStats

slide-12
SLIDE 12

CORTICAL AUTOMATIC PARCELLATION (aparc)

slide-13
SLIDE 13

Thickness and Area ROI Studies

Middle Temporal Gyrus Entorhinal Cortex Thickness of Entorhinal Cortex Surface Area of MTG Gray matter volume also possible

slide-14
SLIDE 14

Surface Mesh (zoom-in)

slide-15
SLIDE 15

Parcellation/Annotation

— Surface ONLY — Annotation format (something.annot) — Each vertex has only one label/index — Index List also found in color lookup table (LUT)

— $FREESUFER_HOME/FreeSurferColorLUT.txt

?h.aparc.annot ?h.aparc.a2009.annot

slide-16
SLIDE 16

Automatic Surface Parcellation: Desikan/Killiany Atlas (35 ROI’s)

Precentral Gyrus Postcentral Gyrus Superior Temporal Gyrus subject label lh.aparc.annot

An automated labeling system for subdividing the human cerebral cortex on MRI scans into gyral based regions of interest, Desikan, R.S., F. Segonne, B. Fischl, B.T. Quinn, B.C. Dickerson, D. Blacker, R.L. Buckner, A.M. Dale, R.P. Maguire, B.T. Hyman, M.S. Albert, and R.J. Killiany, (2006). NeuroImage 31(3):968-80.

slide-17
SLIDE 17

Desikan/Killiany Atlas

  • 40 Subjects
  • 14 Male, 26 Female
  • Ages 18-87
  • 30 Nondemented
  • 10 Demented
  • Siemens 1.5T Vision (Wash U)

An automated labeling system for subdividing the human cerebral cortex on MRI scans into gyral based regions of interest, Desikan, R.S., F. Segonne, B. Fischl, B.T. Quinn, B.C. Dickerson, D. Blacker, R.L. Buckner, A.M. Dale, R.P. Maguire, B.T. Hyman, M.S. Albert, and R.J. Killiany, (2006). NeuroImage 31(3):968-80.

slide-18
SLIDE 18

Automatic Surface Parcellation: Destrieux Atlas

Automatically Parcellating the Human Cerebral Cortex, Fischl, B., A. van der Kouwe, C. Destrieux, E. Halgren, F. Segonne, D. Salat, E. Busa, L. Seidman, J. Goldstein, D. Kennedy,

  • V. Caviness, N. Makris, B. Rosen, and A.M. Dale, (2004). Cerebral Cortex, 14:11-22.
  • 58 Parcellation Units
  • 12 Subjects

subject label lh.aparc.a2009s.annot

slide-19
SLIDE 19

FreeSurfer Stats Outputs

SUBJECTS_DIR subject1 subject2 subject3 … mri label stats lh.aparc.stats – left hemi Desikan/Killiany surface stats rh.aparc.stats – right hemi Desikan/Killiany surface stats lh.aparc.a2009.stats – left hemi Destrieux rh.aparc.a2009.stats – right Destrieux created by mris_anatomical_stats

slide-20
SLIDE 20

Parcellation Stats File

StructName: Name of structure/ROI NumVert: Number of vertices in ROI SurfArea: Surface area in mm2 GrayVol: Volume of gray matter (surface-based) ThickAvg/ThickStd: Average and stddev of thickness in ROI MeanCurv: Mean curvature GausCurv: Mean gaussian curvature FoldInd: Folding index CurvInd: Curvature index

StructName NumVert SurfArea GrayVol ThickAvg ThickStd MeanCurv GausCurv FoldInd CurvInd bankssts 1157 811 1992 2.303 0.567 0.117 0.031 10 1.6 caudalanteriorcingulate 779 543 1908 3.472 0.676 0.185 0.064 26 1.8 caudalmiddlefrontal 3145 2137 5443 2.311 0.593 0.132 0.041 35 5.3 cuneus 1809 1195 2286 1.672 0.411 0.162 0.067 34 4.6 entorhinal 436 265 1269 2.871 0.881 0.119 0.037 5 0.6 fusiform 3307 2126 5161 2.109 0.689 0.144 0.064 71 8.7 inferiorparietal 5184 3514 8343 2.136 0.552 0.146 0.055 82 11.5 inferiortemporal 3746 2610 8752 2.683 0.748 0.178 0.132 140 18.0

slide-21
SLIDE 21

Other ROIs (ex vivo)

V1, V2 Entorhinal Brodmann Areas 6, 4a,4p,3a,3b,1,2 Brodmann Areas 45,44 MT

slide-22
SLIDE 22

Label File

— Easy to draw — Use ‘Select Voxels’ Tool in tkmedit — Or use FreeView — Simple text format

In Volume On Surface

slide-23
SLIDE 23

Example Label Files

SUBJECTS_DIR subject1 subject2 subject3 … mri label stats lh.cortex.label lh.BA1.label lh.BA2.label lh.BA3.label …

slide-24
SLIDE 24

Creating Label Files

— Drawing tools:

— tkmedit, freeview — tksurfer — QDEC

— Deriving from other data

— mris_annotation2label: cortical parcellation broken into units — mri_volcluster:

a volume made into a cluster

— mri_surfcluster: a surface made into a cluster — mri_vol2label: a volume/segmentation made into a label — mri_label2label: label from one space mapped to another

slide-25
SLIDE 25

WHITE MATTER SEGMENTATION (wmparc)

slide-26
SLIDE 26

Gyral White Matter Segmentation

Nearest Cortical Label to point in White Matter wmparc.mgz + +

Salat, et al., Age-associated alterations in cortical gray and white matter signal intensity and gray to white matter contrast. Neuroimage 2009, 48, (1), 21-8.

subject mri wmparc.mgz

slide-27
SLIDE 27

Merged Cortical + Subcortical

aparc+aseg.mgz aseg.mgz aparc No new information For visualization only subject mri aparc+aseg.mgz

slide-28
SLIDE 28

ANALYSIS of STATS

slide-29
SLIDE 29

FreeSurfer Stats Outputs

SUBJECTS_DIR subject1 subject2 subject3 … mri label stats aseg.stats – subcortical volumetric stats wmparc.stats – white matter segmentation volumetric stats lh.aparc.stats – left hemi Desikan/Killiany surface stats rh.aparc.stats – right hemi Desikan/Killiany surface stats lh.aparc.a2009.stats – left hemi Destrieux rh.aparc.a2009.stats – right Destrieux

slide-30
SLIDE 30

Extract table of subcortical volumes

  • f all structures for all subjects

asegstats2table

  • -subjects 001 002 003 004 005
  • -meas volume
  • -stats aseg.stats
  • -tablefile aseg.table.txt

Applies to wmparc.stats too: (--stats wmparc.stats) Output is a simple ASCII text file

slide-31
SLIDE 31

Extract table of average thickness of all cortical structures for all subjects

aparcstats2table

  • -subjects 001 002 003
  • -hemi lh
  • -meas thickness
  • -parc aparc
  • -tablefile aparc_lh_thickness_table.txt

Desikan/Killiany Atlas: --parc aparc Destrieux Atlas:

  • -parc aparc.a2009s
slide-32
SLIDE 32

Extract table of surface area of all cortical structures for all subjects

aparcstats2table

  • -subjects 001 002 003
  • -hemi lh
  • -meas area
  • -parc=aparc
  • -tablefile aparc_lh_area_table.txt
slide-33
SLIDE 33

Extract table of GM volume of cortical structures for all subjects

aparcstats2table

  • -subjects 001 002 003
  • -hemi lh
  • -meas volume
  • -parc=aparc
  • -tablefile aparc_lh_volume_table.txt

Note that the volume of cortical structures is extracted with aparcstats2table whereas the volume of subcortical structures is extracted with asegstats2table.

slide-34
SLIDE 34

Exporting Table Files

— SPSS, oocalc, matlab — Choose: Delimited by spaces

slide-35
SLIDE 35

GLM Analysis on Stats Files

— mri_glmfit (used for image-based group analysis) — Use “--table table.txt” instead of “--y” to specify the input — Eg, “mri_glmfit --table aparc_lh_vol_stats.txt …” — The rest of the command-line is the same as you would

use for a group study (eg, FSGD file and contrasts).

— Output is text file sig.table.dat that lists the significances

(-log10(p)) for each ROI and contrast.

slide-36
SLIDE 36

Summary

— ROIs are Individualized — Subcortical and WM ROIs (Volume) — Surface ROIs (Volume, Area, Thickness) — http://freesurfer.net/fswiki/MorphometryStats — Segmentation vs. Annotation vs. Label File — Extract to table (asegstats2table, aparcstats2table) — Multimodal Applications

slide-37
SLIDE 37

Tutorial

— Simultaneously load: — aparc+aseg.mgz (freeview or tkmedit) — aparc.annot (tksurfer) — FreeSurferColorLUT.txt — View Individual Stats Files — Group Table — Create — Load into spreadsheet

slide-38
SLIDE 38

End of Presentation

slide-39
SLIDE 39

Label File

— Surface or Volume — Simple Text format (usually something.label)

— Each row as 5 Columns: Vertex X Y Z Statistic

— Vertex – 0-based vertex number

— only applies to surfaces, ignored for volumes

— XYZ – coordinates (in one of many systems) — Statistic – often ignored

— Eg, lh.cortex.label

#label , from subject fsaverage 4 88 -42.261 -81.724 -13.242 0.000000 445 -28.781 -85.827 -16.289 0.000000 446 -39.862 -74.518 -14.432 0.000000 616 -42.856 -74.239 -5.499 0.000000

Indicates 4 “points” in label

slide-40
SLIDE 40

ROI Statistic Files

— Simple text files — Volume and Surface ROIs (different formats) — Automatically generated: aseg.stats, lh.aparc.stats,

etc

— Combine multiple subjects into one table with

asegstats2table or aparcstats2table (then import into excel).

— You can generate your own with either

— mri_segstats (volume) — mris_anatomical_stats (surface)

slide-41
SLIDE 41

ROI Studies

— Volumetric/Area — size; number of units that make up the ROI — “Intensity” — average values at point measures (voxels or

vertices) that make up the ROI

slide-42
SLIDE 42

ROI Mean “Intensity” Analysis

— Average vertex/voxel values or “point measures”

  • ver ROI

— MR Intensity (T1) — Thickness, Sulcal Depth — Multimodal — fMRI intensity — FA values (diffusion data)

slide-43
SLIDE 43

ROI Atlas Creation

— Hand label N data sets — Volumetric: CMA — Surface Based: — Desikan/Killiany — Destrieux — Map labels to common coordinate system — Probabilistic Atlas — Probability of a label at a vertex/voxel — Maximum Likelihood (ML) Atlas Labels — Curvature/Intensity means and stddevs — Neighborhood relationships

slide-44
SLIDE 44

Automatic Labeling

— Transform ML labels to individual subject* — Adjust boundaries based on

— Curvature/Intensity statistics — Neighborhood relationships

— Result: labels are customized to each individual.

— You can create your own atlases**

* Formally, we compute maximum a posteriori estimate of the labels given the input data ** Time consuming; first check if necessary

slide-45
SLIDE 45

Validation -- Jackknife

— Hand label N Data Sets — Create atlas from (N-1) Data Sets — Automatically label the left out Data Set — Compare to Hand-Labeled — Repeat, Leaving out a different data set each time

slide-46
SLIDE 46

Clusters

— Clusters (significance map; functional activation)

— One output of mri_volcluster and mri_surfcluster — are segmentations or annotation (volume vs. surface) — Each cluster gets its own number/index — Masks (another type of segmentation)

— Binary: 0, 1 — Can be derived by thresholding statistical maps

Activation Clusters Thresholded Activity

slide-47
SLIDE 47

ROI Mean “Intensity” Studies

Salat, et al, 2004.

Sigalovsky, et al, 2006

Greve, et al, 2008. Physiological Noise

R1 Intensity Thickness fMRI