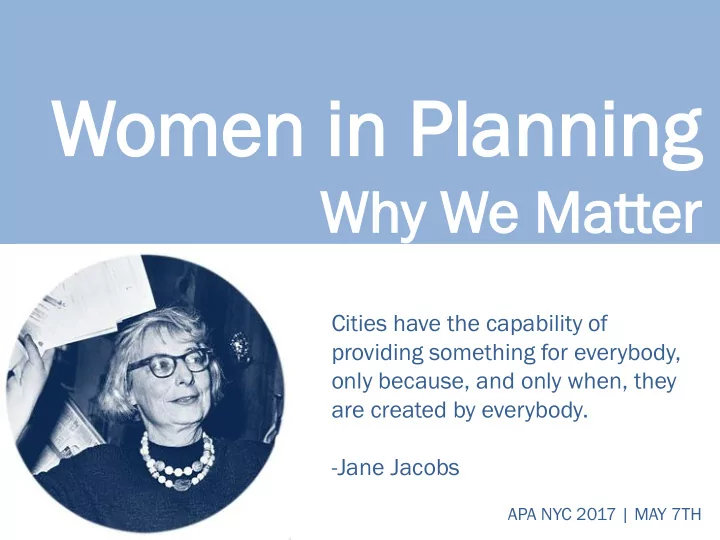
SLIDE 1 Women
in Pla Planning nning
Why We Mat e Matter er
APA NYC 2017 | MAY 7TH
Cities have the capability of providing something for everybody,
- nly because, and only when, they
are created by everybody.
SLIDE 2 Who ho We Ar e Are
Veronica Siranosian AECOM Monica Villalobos AECOM Georgia Sheridan LA County Metro Meghna Khanna LA County Metro
SLIDE 3
Cli Clichés chés + + St Stereo ereotypes types
SLIDE 4
SLIDE 5
SLIDE 6
SLIDE 7
SLIDE 8
SLIDE 9
SLIDE 10
Tra ravel el Patt Patterns erns
SLIDE 11 Wom
en in the Ci n the City ty
Roles + Implications
- Power of the purse (Control 80% of consumer
spending)
- Higher portion of transit riders
- Predominant targets of subway crime
- Primary caretakers
- Multi-purpose, multi-modal, chained trips
SLIDE 12 You
Get Wh What t You
Measure asure
SLIDE 13 You
Get Wha hat t You
Measure asure
Source: The Economist
SLIDE 14 Ho How Wom
en Mo Move
Source: US Census ACS, 2012
SLIDE 15 Ho How Wom
en Mo Move
Source: The Relationship Between Gender and Transport, Inter American Development Bank Just of women have a driver’s license
57%
DIFFERENCES IN TRANSPORT SYSTEMS FOR MEN AND WOMEN
25% 15%
Women perform on average more trips than men, mainly, These trips, however, shorter than those made by men
walking and bus.
12% 18%
SLIDE 16
SLIDE 17
SLIDE 18 Safety ty and nd Mo Mode de Cho hoice ce
63% of New York City subway riders said they'd
been harassed on a train
93% of witnesses reported that the victim was
female
Source: NY Times
SLIDE 19 I am parking as close to [my destination] as I can. I’m definitely looking around and being very self-aware, understanding that it is important to be alert.…
—Amy Stear, Wisconsin Director of 9to5
SLIDE 20 Safety ty and nd Mo Mode de Cho hoice ce
Source: http://brokelyn.com
SLIDE 21
Safety ty and nd Mo Mode de Cho hoice ce
SLIDE 22 Mo Mobi bility lity of
re
Source: The Relationship Between Gender and Transport, Inter American Development Bank
SLIDE 23 Mo Mobi bility lity of
re
Source: Ines Sánchez de Madariaga (2009, 2010, 2013a, 2013b)
SLIDE 24
SLIDE 25 Tri rip Cha haining ining
Source: EMBARQ India, 2015
SLIDE 26 Tri rip Cha haining ining
Source: McGukin et al., 2005
SLIDE 27
Con Conscious scious Des Design ign
SLIDE 28
SLIDE 29
ting on:
- bus stop
- underground station
platforms
king:
structures
- surface parking lot
- to/from bus stop or station
- Travel
l on
We Don’t
SLIDE 30 Sec ecurity urity Str trat ategies egies
Source: Web-based transit survey of 245 transit agencies; How to Ease Women’s Fear of Transportation Environments: Case Studies and Best Practices
80 78 72 58 40 38 32 28 26 10 5 5 12 15 12 6 8 12 10 20 30 40 50 60 70 80 90
Buses Bus Stops
SLIDE 31
- Transparent/visible design
- Good Lighting
- “Whole Journey” approach
“Whole Journey” approach Lighti ting ng Design
Impr Improvements ements
- Segregated transport schemes
- “Next bus” or “Next train” signs
- Safety personnel over CCTV
- “Next bus” or “Next train” signs
SLIDE 32 Typ ypical cal Bus us Stops
Typ ypical ical Bus us St Stop
SLIDE 33 Solar Powered ered Bus Shelter er, San Francisco cisco
SLIDE 34 C B B A C A D D
Osmose station, Paris’ RATP’s Program
SLIDE 35 Und nder ergr ground
Rail l Stations tations
SLIDE 36 Hafenci ncity ty Un University sity Subway y Stati tion,
urg, German any
SLIDE 37 Fulton
tion,
U-Bahn Bahn Stati tion,
ich, German any
SLIDE 38
Pede edestrian strian Tun unnels nels
SLIDE 39 King Cross ss Light t tunne nel ,Londo don
SLIDE 40 King Cross ss Light t tunne nel ,Londo don
SLIDE 41 King Cross ss Light t tunne nel ,Londo don Marien enplatz atz U-Bahn, ahn, Munich, ch, German any
SLIDE 42 Station tation En Entrance/ trance/Exit Exit
Broadw dway-Laf Lafayet ette/Bleeck eecker Transf nsfer , Ne New York rk
SLIDE 43 Station tation En Entrance/ trance/Exit Exit
34 34th
th Stre
reet et –Hu Huds dson
d Stati tion
SLIDE 44 Station tation En Entrance/ trance/Exit Exit
34 34th
th Stre
reet et –Hu Huds dson
d Stati tion
SLIDE 45 Fra rauen uen-Wer erk-Stadt Stadt
A Housin ing g Proje ject ct by & f & for Women in in Vie ienna Austri ria
Childcare facilities Shops including doctor’s Office Housing Units Courtyards Public Spaces Source: Gendered Innovations
SLIDE 46 Fra rauen uen-Werk erk-Sta Stadt dt
Gen ende der-sen ensit itiv ive pe perspe pecti ctive
Source: Gendered Innovations
SLIDE 47
The “Fearless Gi Girl rl” statue tatue
SLIDE 48 Pr Programs/Initiativ
es
SLIDE 49 Ge Gend nder er Ma Mainstreaming, instreaming, Vi Vienna enna
Source: : https:/ tps://di /difu.de fu.de/n /node/ de/59 5949 49
SLIDE 50
Ge Gend nder er Ma Mainstreaming, instreaming, Vi Vienna enna
SLIDE 51
Ha Hands nds Of Off, f, LA LA Cou County nty Metr Metro
SLIDE 52
Ri Righ ght t Ri Rides, des, NY NY & & DC DC
SLIDE 53 Pink nk Li Ligh ght, t, Sou
th Kor
ea
SLIDE 54 Tra ranspor nsport t for
London ndon
SLIDE 55
SafetiPin tiPin Ap App, p, In India dia
SLIDE 56 Wom
en-Only Only Car, , In India dia
SLIDE 57
Pink nk aut uto-ricksha rickshaws, ws, In India dia
SLIDE 58 Queen Queen Bee or Bee or Wor
er Bees? Bees?
SLIDE 59 Am Amer erican ican Wom
en
Mo More e Women men in College
- llege
- 50.8% of population
- 59% of college-educated
workforce
- 60% of college degrees
- 60% of masters degrees
- 47% of law degrees
- 48% of medical degrees
- 47% of labor force
Sources: FireScience.org, FAS.org, AmericanProgress.org
SLIDE 60 Wom
en at t Work
Pu Publ blic ic Sect ctor
- 58% of state and local government jobs
- 42% of federal governments jobs
- 20% of leadership positions
- Women-held jobs in local gov increased 13.7% (1976-2013)
Pr Privat ate e Sect ctor
- r
- 42% of jobs
- 15% of senior leadership positions
- <9% of top leadership positions
- Pay gap between men and women more pronounced
Sources: FireScience.org, FAS.org, AmericanProgress.org
SLIDE 61 Wom
en of
Fac acing ing a W a Wider er Gap ap
- 18% of U.S. population
- 1/3rd of female workforce
- 12% of managerial positions
- Less than 3% of board seats in Fortune 500
companies
- Over 2/3rd of Fortune 500 companies have no
women of color as board members
Sources: FireScience.org, FAS.org, Americanprogress.org
SLIDE 62 Ge Gend nder er Pa Pay y Ga Gap p Ov Over er Ti Time
Women Make 80% of Men’s Earnings (2015)
Source: AAUW analysis of data from Proctor et al., U.S. Census Bureau, Income and Poverty in the United States: 2015
SLIDE 63 Wom
en Pla lanner nners
On average, men make more
$8 $8K
a year more than women, get
$1 $1,70 700
more in cash compensation Sources: APA/AICP 2016 Planners Salary Survey by Gender and Heritage/Race
Make 91% of Men’s Earnings (2014)
SLIDE 64 Wom
en in Aca cademia demia
women 2:1 in full professorship
15), men make almost do doub uble le
SLIDE 65
SLIDE 66
SLIDE 67 Scholarship, Why it Matters…
Not your Grandma’s City
SLIDE 68
Th The W e Wage ge Ga Gap, , Wh Why it Matt y it Matter ers... s...
SLIDE 69
De Decision cision Ma Maki king ng
SLIDE 70 Acr cross
the e Wor
ld
Source: United Nations
SLIDE 71 Wom
en in Co n Cong ngress ress
104 of 535 21 of 100 U.S. Representatives U.S. Senators
Source: CAWP (Center for American Women and Politics), AmericanProgress.org
U.S. ranks 60th in women’s political empowerment on the Gender Gap Index.
SLIDE 72 Wom
en CEOs EOs of
&P 500 00
29 of 500 CEOs
Source: Catalyst Org 6%
SLIDE 73 Qu Questions? estions?
Veronica Siranosian AECOM Monica Villalobos AECOM Georgia Sheridan LA County Metro Meghna Khanna LA County Metro
SLIDE 74 Th Thank Y ank You
SLIDE 75
SLIDE 76 Celebrating women’s contributions to the built environment