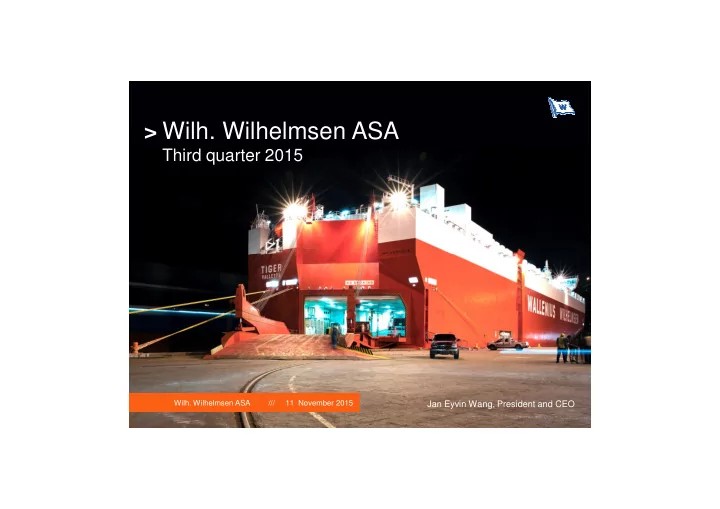

> Wilh. Wilhelmsen ASA Third quarter 2015 Wilh. Wilhelmsen ASA /// 11 November 2015 Jan Eyvin Wang, President and CEO
> Disclaimer This presentation contains forward-looking expectations which are subject to risk and uncertainties related to economic and market conditions in relevant markets, oil prices, currency exchange fluctuations etc. Wilh. Wilhelmsen ASA group undertake no liability and make no representation or warranty for the information and expectations given in the presentation. 2
> Anti-trust investigation WWASA makes USD 200 million provision in the third quarter • Investigation of the global car carrying industry started in September 2012 in several jurisdictions related to incidents prior to September 2012 • WWL and EUKOR have cooperated and are cooperating with respective authorities. These processes are confidential. • Japanese and South African authorities have completed their investigations – WWL were fined USD 34 million in Japan and USD 8 million in South Africa (WWASA share USD 16.5 million and USD 4 million respectively) • Final outcome of the investigations is uncertain and will take time – Some further clarifications expected in Q4 2015 and 2016 • The USD 200 million provision represents WWASA’s share of the exposure related to the ongoing investigations 3
> Decline in group volumes Down of 7% q-o-q and 3% y-o-y Million Cbm 22 -3% -7% 20 18 16 14 12 10 8 6 4 2 0 Q4 Q1 Q2 Q3 Q4 Q1 Q2 Q3 Q4 Q1 Q2 Q3 Q4 Q1 Q2 Q3 Q4 Q1 Q2 Q3 Q4 Q1 Q2 Q3 Q4 Q1 Q2 Q3 08 09 09 09 09 10 10 10 10 11 11 11 11 12 12 12 12 13 13 13 13 14 14 14 14 15 15 15 4 Prorated ocean volumes – WW group (100%)
> Fall in both cargo segments High and Heavy Auto • Decline in all main trades • Oceania stronger and Europe slightly better • Construction volumes to North America remained strong, however weaker than first • Decline in all other trades half of the year Index Unprorated ocean volumes – WWL and EUKOR (100%) 5
> Renewal of Ocean Carrier Contract • EUKOR secured contract for 4 more years • Volumes out of Korea; - 50% in 2016 and 2017 - 40% in 2018 and 2019 • In 2014, EUKOR transported approximately 4.6 million units of which 1.7 million where on behalf of Hyundai and Kia 6
> Making use of the tonnage flexibility Group tonnage Newbuildings Secured flexible tonnage # Vessels 150 147 147 147 146 146 145 145 145 145 143 140 139 140 137 * 135 130 ** 127 125 120 115 110 Q1 Q2 Q3 Q4 Q1 Q2 Q3 Q4 Q1 Q2 Q3 Q4 Q1 Q2 Q3 2013 2014 2015 2016 * Base case - Secured capacity not including upside potential through possible charter-in’s ** Vessels recycled at 25 years and all TC vessels redelivered at end of ordinary contract period, newbuilding included 7 Other reduction flexibility options include; Renegotiation of charter terms, sale of vessels, slow steaming
> Continued low commodity prices impact HH volumes Lower growth in annual Chinese car sales Light vehicle sales in key markets quarterly [M Units] CAT - Resource industries sales quarterly [MUSD] QoQ YoY 2015 FY 2016 FY 2016/ 7 Region Q3 2015 Q2 2015 change Q3 2014 change FC FC 2015 6 N America 5,29 5,44 -3 % 5,08 4 % 20,30 20,60 1 % 5 Europe* 3,74 4,22 -11 % 3,42 9 % 15,60 15,80 1 % 4 3 Oceania 0,32 0,33 -3 % 0,31 4 % 1,30 1,30 0 % BRICs 7,02 7,55 -8 % 7,50 -7 % 31,40 33,30 6 % 2 .....Brazil 0,62 0,63 -1 % 0,83 -26 % 2,50 2,40 -4 % 1 .....Russia 0,41 0,40 3 % 0,55 -25 % 1,60 1,60 0 % 0 Q1 Q2 Q3 Q4 Q1 Q2 Q3 Q4 Q1 Q2 Q3 Q4 Q1 Q2 Q3 Q4 Q1 Q2 Q3 Q4 Q1 Q2 Q3 .....India 0,77 0,73 5 % 0,75 3 % 3,20 3,50 9 % 2010 2011 2012 2013 2014 2015 .....China 5,22 5,79 -7 % 5,37 -3 % 24,10 25,80 7 % *excluding Russia and Turkey John Deere - Q3 2015 industry outlook Quarterly light vehicle exports [M Units] Japan Korea 2 000 000 1 500 000 1 000 000 500 000 0 Q1 Q3 Q1 Q3 Q1 Q3 Q1 Q3 Q1 Q3 Q1 Q3 Q1 Q3 Q1 Q3 2008 2009 2010 2011 2012 2013 2014 2015 *Agriculture and Turf Retail Sales 8
> Outlook Auto • Marginal growth in mature markets • Growth in China but at lower levels • Slow in other emerging markets High and heavy • Construction to remain healthy • Mining and agricultural to remain weak Tonnage • Using tonnage flexibility to remain balanced � � � � Increased focus on synergies and cost reductions in all companies � � Continue to expand land based activities � � 9
> Prospect The shipping activities in WWASA are expected to remain challenging, with added pressure on margins. Logistics activities are expected to be on par with the 2015 levels. The board will ensure a continuous focus on operational efficiency and cost- reducing initiatives. 10
> Wilh. Wilhelmsen ASA Third quarter 2015 Wilh.Wilhelmsen ASA 11 November 2015 Benedicte B. Agerup, CFO
> WWASA Group – Key financials Provision impact shipping segment negatively in Q3 • Total income reported - 6% q-o-q, - 14% y-o-y • EBIT reported negative USD 134 million, EBIT adjusted for non-recurring items USD 68 million • Shipping segment negatively impacted by a provision of USD 200 million • Lower ocean profitability q-o-q, partly seasonal, logistics stable 2014 2015 Total income Total EBIT USD million USD million 98 682 700 100 650 637 76 624 73 609 66 596 57 54 600 558 -6% 50 500 0 400 -284% 300 -50 200 -100 100 0 -150 -134 Q1 Q2 Q3 Q4 Q1 Q2 Q3 Q4 12
Recommend
More recommend