SLIDE 1
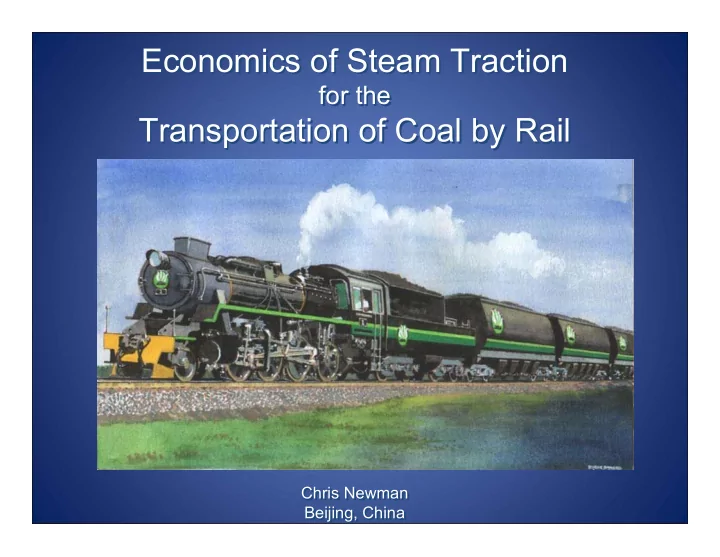
Economics of Steam Traction
for the
Transportation of Coal by Rail Economics of Steam Traction
for the
Transportation of Coal by Rail
Chris Newman Beijing, China Chris Newman Chris Newman Beijing, China Beijing, China
SLIDE 2 Synopsis
- There is unfinished business in improving the design of steam
traction;
- Development continued through the second half of the 20th
century by the late A Chapelon and L.D. Porta, with a doubling of the thermal efficiency.
- Economics of steam traction for coal haulage appear much
better than diesel or electric traction in developing countries – even with old locomotives.
- Ability to burn a variety of renewable fuels, though this needs
further development.
- Future development of steam traction could see efficiency
levels approaching those of diesel traction.
Synopsis
- There is unfinished business in improving the design of steam
traction;
- Development continued through the second half of the 20th
century by the late A Chapelon and L.D. Porta, with a doubling of the thermal efficiency.
- Economics of steam traction for coal haulage appear much
better than diesel or electric traction in developing countries – even with old locomotives.
- Ability to burn a variety of renewable fuels, though this needs
further development.
- Future development of steam traction could see efficiency
levels approaching those of diesel traction.
SLIDE 3 Introduction to Steam Traction
- Technology dates from 1803 during the time of the Industrial
Revolution in Britain;
- Developed empirically over 150 years with inadequate
understanding of scientific principles;
- Steam locomotives were slower, less efficient, less reliable
and more polluting than they need have been;
- Steam’s ability to operate without adequate maintenance
meant that it did operate with inadequate maintenance;
- Steam traction has never had an effective marketing
campaign to rival that of GM and other diesel builders.
Introduction to Introduction to Steam Traction Steam Traction
- Technology dates from 1803 during the time of the Industrial
Revolution in Britain;
- Developed empirically over 150 years with inadequate
understanding of scientific principles;
- Steam locomotives were slower, less efficient, less reliable
and more polluting than they need have been;
- Steam’s ability to operate without adequate maintenance
meant that it did operate with inadequate maintenance;
- Steam traction has never had an effective marketing
campaign to rival that of GM and other diesel builders.
SLIDE 4 Inside a Locomotive Inside a Locomotive
- Open cycle with water as the process fluid
- Fuel burned in firebox with air drawn in from underneath the fire
- Energy is added to the water in the boiler and extracted from the
steam in the cylinders
- Spent steam & combustion gases mixed in the exhaust system
- Thermal efficiency <8%.
- Open cycle with water as the process fluid
Open cycle with water as the process fluid
- Fuel burned in firebox with air drawn in from underneath the fir
Fuel burned in firebox with air drawn in from underneath the fire e
- Energy is added to the water in the boiler and extracted from th
Energy is added to the water in the boiler and extracted from the e steam in the cylinders steam in the cylinders
- Spent steam & combustion gases mixed in the exhaust system
Spent steam & combustion gases mixed in the exhaust system
Thermal efficiency <8%.
SLIDE 5
- Steam locos hauled prodigious loads in the USA (over
15,000t) in the pre-roller bearing era.
- As far as Australia is concerned, development of steam
traction ended in the 1920s.
- Rotational speeds were about half of AAR design guidelines.
- Steam locos hauled prodigious loads in the USA (over
Steam locos hauled prodigious loads in the USA (over 15,000t) in the pre 15,000t) in the pre-
roller bearing era.
- As far as Australia is concerned, development of steam
As far as Australia is concerned, development of steam traction ended in the 1920s. traction ended in the 1920s.
- Rotational speeds were about half of AAR design guidelines.
Rotational speeds were about half of AAR design guidelines.
SLIDE 6
- 48 tonne locos built by Mitsubishi in 1956 and 1963
- Power Output increased from 520 kW to 900 kW by Porta;
- Ash clinkering problems overcome by Gas Producer firebox;
- 1700 tonne trains routinely hauled (tested to 3000 tonnes);
- Very high mileage between overhauls.
- All-steam railway until 1997;
- Can sustain 28 dbhp/ton.
- 48 tonne locos built by Mitsubishi in 1956 and 1963
48 tonne locos built by Mitsubishi in 1956 and 1963
- Power Output increased from 520 kW to 900 kW by Porta;
Power Output increased from 520 kW to 900 kW by Porta;
- Ash clinkering problems overcome by Gas Producer firebox;
Ash clinkering problems overcome by Gas Producer firebox;
- 1700 tonne trains routinely hauled (tested to 3000 tonnes);
1700 tonne trains routinely hauled (tested to 3000 tonnes);
- Very high mileage between overhauls.
Very high mileage between overhauls.
All-
- steam railway until 1997;
steam railway until 1997;
Can sustain 28 dbhp dbhp/ton. /ton.
Porta’s locos on the Rio Turbio Railway Porta’s locos on the Rio Turbio Railway
SLIDE 7
SLIDE 8 Reliability Record for Rio Turbio Railway’s Locos Reliability Record for Rio Turbio Railway’s Locos
- 480,000 km before driving axlebox
(white metal) bearings needed replacing = 180 million revolutions of the 850mm dia driving wheels;
- 70,000 km between tyre profiling = 26
million revolutions;
- No superheater replacements in
500,000 km despite high steam temperatures (>400oC);
- No boiler tube replacement-400,000 km
(apart from tubes damaged during installation);
- No boiler repairs in 400,000 km service;
- Piston rod packings lasted 400,000 km
(150 million revolutions);
- Max steam leakage 1.7% of max
evaporation after 70,000 km.
- 480,000 km before driving axlebox
480,000 km before driving axlebox (white metal) bearings needed (white metal) bearings needed replacing = 180 million revolutions of replacing = 180 million revolutions of the 850mm the 850mm dia dia driving wheels; driving wheels;
- 70,000 km between tyre profiling = 26
70,000 km between tyre profiling = 26 million revolutions; million revolutions;
- No superheater replacements in
No superheater replacements in 500,000 km despite high steam 500,000 km despite high steam temperatures (>400 temperatures (>400o
C);
- No boiler tube replacement
No boiler tube replacement-
400,000 km (apart from tubes damaged during (apart from tubes damaged during installation); installation);
- No boiler repairs in 400,000 km service;
No boiler repairs in 400,000 km service;
- Piston rod packings lasted 400,000 km
Piston rod packings lasted 400,000 km (150 million revolutions); (150 million revolutions);
- Max steam leakage 1.7% of max
Max steam leakage 1.7% of max evaporation after 70,000 km. evaporation after 70,000 km.
SLIDE 9
David Wardale David Wardale
Wardale’s “Red Devil”: rebuild of SAR 1950s Class 25. Achieved 60% increase in power & 40% reduction in specific coal consumption. Wardale says that every part of the locomotive could be improved further. Wardale Wardale’ ’s s “ “Red Devil Red Devil” ”: rebuild of SAR : rebuild of SAR 1950s Class 25. 1950s Class 25. Achieved 60% increase in power & 40% Achieved 60% increase in power & 40% reduction in specific coal consumption. reduction in specific coal consumption. Wardale says that every part of the Wardale says that every part of the locomotive could be improved further. locomotive could be improved further.
SLIDE 10 The 5AT – “Second Generation Steam” The 5AT – “Second Generation Steam”
- Conceived by David Wardale;
- First new steam loco design to adopt Porta’s developments;
- Max design speed 200 km/h;
- Target – tour and cruise trains in UK and Europe;
- Fundamental Design Calculations completed;
- Can be modified for freight haulage (using smaller wheels).
- Conceived by David Wardale;
Conceived by David Wardale;
First new new steam loco design to adopt Porta steam loco design to adopt Porta’ ’s developments; s developments;
- Max design speed 200 km/h;
Max design speed 200 km/h;
Target – – tour and cruise trains in UK and Europe; tour and cruise trains in UK and Europe;
- Fundamental Design Calculations completed;
Fundamental Design Calculations completed;
- Can be modified for freight haulage (using smaller wheels).
Can be modified for freight haulage (using smaller wheels).
SLIDE 11 The 8AT The 8AT
- Uses same boiler, cylinders, cab, tender and motion as 5AT;
- 1.325 m dia. driving wheels give 192 kN drawbar tractive force;
- Max power - 2100 kW at drawbar at 120 km/h; 1800 kW at 80 km/h;
- Starting tractive force – 192 kN at the drawbar;
- 21 tonne axle load (including ballast) to control slipping;
- Able to haul 3000 tonne coal trains at 95 km/h on level track.
- Uses same boiler, cylinders, cab, tender and motion as 5AT;
Uses same boiler, cylinders, cab, tender and motion as 5AT;
1.325 m dia
- dia. driving wheels give 192 kN drawbar tractive force;
. driving wheels give 192 kN drawbar tractive force;
Max power -
- 2100 kW at drawbar at 120 km/h; 1800 kW at 80 km/h;
2100 kW at drawbar at 120 km/h; 1800 kW at 80 km/h;
Starting tractive force – – 192 kN at the drawbar; 192 kN at the drawbar;
- 21 tonne axle load (including ballast) to control slipping;
21 tonne axle load (including ballast) to control slipping;
- Able to haul 3000 tonne coal trains at 95 km/h on level track.
Able to haul 3000 tonne coal trains at 95 km/h on level track.
SLIDE 12
Is the 8AT Haulage Capacity realistic ?? Is the 8AT Haulage Capacity realistic ?? Is the 8AT Haulage Capacity realistic ??
American 2-8-0 locomotive of similar size and “tractive effort” to the 8AT, but with no superheat, low boiler pressure & plain bearings, hauling 6,450 US tons. American 2-8-0 locomotive of similar size and “tractive effort” to the 8AT, but with no superheat, low boiler pressure & plain bearings, hauling 6,450 US tons.
SLIDE 13 Hypothetical Railway Operation
- Single purpose railway for transporting 20 million tons of
coal 100km from a mine site to an export terminal;
- Near-level terrain;
- Operates 24/7;
- Max speed 80 km/h, average speed 50 km/h
(loaded & empty);
- Single line operation with passing loops;
- Trains loaded and unloaded as soon as they arrive at each
end;
- Locomotives remain attached to their trains for servicing.
Hypothetical Railway Operation
- Single purpose railway for transporting 20 million tons of
coal 100km from a mine site to an export terminal;
- Near-level terrain;
- Operates 24/7;
- Max speed 80 km/h, average speed 50 km/h
(loaded & empty);
- Single line operation with passing loops;
- Trains loaded and unloaded as soon as they arrive at each
end;
- Locomotives remain attached to their trains for servicing.
SLIDE 14 Haulage Capabilities Alternative Traction Types Haulage Capabilities Haulage Capabilities Alternative Traction Types Alternative Traction Types
Chinese SS-3 4320 kW Electric Loco Chinese DF4-D 2940 kW Diesel Loco Chinese QJ 2600 kW Steam Loco 8AT 2100 kW Modern Steam Loco Chinese SS-3 4320 kW Electric Loco Chinese DF4-D 2940 kW Diesel Loco Chinese QJ 2600 kW Steam Loco 8AT 2100 kW Modern Steam Loco
SLIDE 15 Loco Type Loco Type QJ Old Steam 8AT New Steam Diesel DF4-D Electric SS-3 Wheel Arrangement Wheel Arrangement 2 2-
10-
2 2 2-
8-
Co Co-
Co Co Co-
Co Max Power Output kW Max Power Output kW (wheel rim) (wheel rim) 2600 2600 2100 2100 2430 2430 4320 4320 Max Speed (km/h) Max Speed (km/h) 80 80 100 100 100 100 100 100 Loco Weight excluding Loco Weight excluding tender (tonnes) tender (tonnes) 134 134 96 96 138 138 138 138 Axle Loading (tonnes) Axle Loading (tonnes) 20.5 20.5 21 21 23 23 23 23 Adhesive Weight Adhesive Weight (tonnes)
(tonnes)
100.5 100.5 84 84 138 138 138 138 Starting Wheel Rim Tractive Starting Wheel Rim Tractive Effort (kN) Effort (kN) 287 287 206 206 480 480 487 487 Continuous Wheel Rim TE at Continuous Wheel Rim TE at 20km/h 20km/h 244 244 163 163 385 385 385 385 Reqd
. Starting Friction Coeff Coeff. . 0.29 0.29 0.25 0.25 0.36 0.36 0.36 0.36
SLIDE 16 SS-3 and DF4-D - Tractive Force vs Speed Graphs SS SS-
3 and DF4-
D -
Tractive Force vs vs Speed Speed Graphs Graphs
SLIDE 17 QJ Performance Graphs Tractive Force vs. Speed
and steaming rates QJ Performance QJ Performance Graphs Graphs Tractive Force vs. Tractive Force vs. Speed Speed
- ver a range of cut
- ver a range of cut-
- offs
- ffs
and steaming rates and steaming rates
SLIDE 18
8AT Performance Graphs Maximum Tractive Force and Power vs. Speed 8AT Performance Graphs 8AT Performance Graphs Maximum Tractive Force and Power vs. Speed Maximum Tractive Force and Power vs. Speed
SLIDE 19
Comparison of Formulae for Determining Specific Rolling Resistance of Freight Wagons
SLIDE 20 Train Haulage Estimates for Steam, Diesel and Electric Traction
Old Steam Modern Steam Diesel Electric
Loco Type QJ 8AT DF4-D SS-3 Loco Weight (including tender) 200 170 138 138 Power Rating kW (wheel rim) 2200 1700 2940 4320 Max Design Speed (km/h) 85 100 100 100 Max Continuous Speed with 3,000 t train 85 85 100 100 Max Continuous Speed with 3,500 t train 85 80 100 100 Max Continuous Speed with 4,000 t train 80 70 95 100 Max Continuous Speed with 5,000 t train 70 60 75 100 Max Continuous Speed with 6,000 t train 65 70 100 Max Continuous Speed with 7,000 t train 60
100 Max Continuous Speed with 8,000 t train
90 Max Continuous Speed with 9,000 t train
78 Max train weight for 80km/h on level track 4,100 3,200+ 4,700 8,700 Stalling (5 km/h) Grade for Max Train Size 0.56% 0.48% 0.91% 0.41% Train (inc loco weight) / Loco Weight Ratio 21.5 19.8 36.5 66.2
SLIDE 21
Estimating Ideal Train Capacities
We have minimum train capacity Wt = Th x 2 x dL / V
If target annual throughput = 20 million tonnes per year, this equates to 62,500 tonnes per day over a 320 day year. Assume the railway operation is only 75% efficient, then target daily throughput = 83,333 tonnes per day or Th = 3472 t/h x 24 hours. Thus if the railway length is 100 km, V = 50 km/h and there are 4 passing loops, the distance between loops, dL = 20 km from which can be calculated the minimum train capacity Wt = 3472 x 2 x 20 / 50 = 2778 tonnes. If we assume the use of Chinese C70 wagons with a gross weight of 93 tonnes and tare weight of 23 tonnes, we can deduct that the train needs 40 wagons with a gross weight of 3720 tonnes and net weight of 2800 tonnes. We can thus use the maximum train loads for each locomotive type to determine the number of passing loops required for each type.
SLIDE 22
Estimating Optimum Train Sizes to deliver 83,000 tonnes per day Estimating Optimum Train Sizes to deliver 83,000 tonnes per day Item units QJ 8AT DF4 SS3 Max Haulage Capacity for 80 km/h (loaded) tonne 4,100 3,200* 4,700 8,700 Equiv net capacity with 70t net 23t tare wagons tonne 3,086 2,409 3,538 6,548 Minimum required trains per day No. 27 34.6 23.6 12.7 Max distance between trains at 50km/h Km 44.4 34.7 50.9 94.3 Max distance between passing loops Km 22.2 17.3 25.5 47.1 Theoretical No. of passing loops in 100 km No. 3.50 4.77 2.93 1.12 Actual minimum number of passing loops No. 4 5 3 2 Minimum number of trains in transit No. 5 6 4 3 Distance between passing loops Km 20.0 16.7 25.0 33.3 Train Arrival Frequency Mins 48 40 60 80 Required net tonnes per train Tonne 2,778 2,315 3,472 4,630 Minimum number of 70 t wagons No. 40 34 50 67 Actual train load (net) Tonne 2,800 2,380 3,500 4,690 Actual train weight (gross) Tonne 3,720 3,162 4,650 6,231 Percentage of loco capacity required % 91% 99% 99% 72%
SLIDE 23 Estimating Target Train Loading Rates Estimating Target Train Loading Rates
Activity units QJ 8AT DF4 SS3
Net Train Capacity tonne 2,800 2,380 3,500 4,690 Train Arrival Frequency mins 48 40 60 80 Arrival checks and documentation mins 3 3 3 3 Travel round 1.6 km balloon loop @ 20km/h mins 5 5 5 5 Position train under loading chute mins 1 1 1 1 Time to move train clear of loading chute mins 1 1 1 1 Refill tender water tank mins 8 6
- Dispatch checks and documentation
mins inc inc 3 3 Time available for train filling mins 30 24 47 67 Required Coal Loading Rate t/h 5,600 6,000 4,450 4,200
SLIDE 24 Unloading Station
More complex than loading system because of the need to take account of the unloading method (rotary or bottom dump) and also locomotive servicing requirements.
- Steam traction will require ash removal, lubrication, sand refilling
- etc. at least once per 200 km round trip, and may need refuelling,
watering and ash removal at each end of the line.
- Diesels will need refuelling and servicing every 2 or 3 round trips.
Time available for unloading wagons may thus be very short, requiring high unloading rates that may be unachievable with a rotary unloader (limited to ~7,000 t/h max). Thus it may be necessary to have two (or more) trains at the unloading station at any time.
Unloading Station
More complex than loading system because of the need to take account of the unloading method (rotary or bottom dump) and also locomotive servicing requirements.
- Steam traction will require ash removal, lubrication, sand refilling
- etc. at least once per 200 km round trip, and may need refuelling,
watering and ash removal at each end of the line.
- Diesels will need refuelling and servicing every 2 or 3 round trips.
Time available for unloading wagons may thus be very short, requiring high unloading rates that may be unachievable with a rotary unloader (limited to ~7,000 t/h max). Thus it may be necessary to have two (or more) trains at the unloading station at any time.
SLIDE 25 Loco Servicing Facility
- Loco is serviced, coaled & watered while still connected to train.
- Locomotive coal should be the best available from mine.
- Mechanised coal, sand and ash handling, dust capture, etc.
Loco Servicing Facility
- Loco is serviced, coaled & watered while still connected to train.
- Locomotive coal should be the best available from mine.
- Mechanised coal, sand and ash handling, dust capture, etc.
SLIDE 26 Estimating Rolling Stock Requirements - 1 Estimating Rolling Stock Requirements - 1
Minimum Number of Locos and Trains Required to Operate Railway Item Units QJ 8AT DF4 SS3
- Reqd. No. of passing loops
unit 4 5 3 2 Number of trains in transit unit 5 6 4 3 Required train mass (net) tonne 2,800 2,380 3,500 4,690 Required train mass (gross) tonne 3,720 3,162 4,650 6,231 Number of trains at loader unit 1 1 1 1 Minimum train loading rate t/h 5,600 6,000 4,450 4,200
- Reqd. rotary unloader capacity
t/h 1x5000 1x5000 1x5000 1x7000 Number of trains at unloader unit 2 2 2 1 Available time for loco servicing mins 43 35 50 25
SLIDE 27 Estimating Rolling Stock Requirements - 2
Annual Distance Operated
Additional locomotive requirements to cover maintenance can be estimated from maintenance frequency, maintenance downtime, and annual mileage of
- locomotives. Annual mileage is calculated as follows:
Estimating Rolling Stock Requirements - 2
Annual Distance Operated
Additional locomotive requirements to cover maintenance can be estimated from maintenance frequency, maintenance downtime, and annual mileage of
- locomotives. Annual mileage is calculated as follows:
Units QJ 8AT DF4 SS3 Number of wagons per train Unit 40 34 50 67 Loco standing time at loading station Mins 48 40 60 80 Number of locos at unloading station unit 2 2 1 1 Loco standing time at unloading station Mins 96 80 60 80 Travel time on line (both ways) Mins 120 120 120 120 Total turnaround time for each loco hours 6.4 6.0 6.5 7.1 Number of round trips per day per loco unit 3.8 4.0 3.7 3.4 Distance traveled by each loco per day km 750 800 738 675 Annual distance per locomotive km 240,000 256,000 236,000 216,000
SLIDE 28 Estimating Rolling Stock Requirements - 3
Servicing requirements (from Chinese data):
Estimating Rolling Stock Requirements - 3
Servicing requirements (from Chinese data):
QJ 8AT DF4 SS3 Annual mileage for each locomotive km 240,000 256,000 236,000 216,000 Major overhaul period km 250,000 500,000 700,000 1,200,000 Time to complete major overhaul days 15 15 15 15 Intermediate overhaul period km 83,333 125,000 233,333 400,000 Time to complete major overhaul days 6 6 6 6 Scheduled maintenance period km 22,500 24,000 30,000 40,000 Time to complete scheduled maint. days 2 2 2 2
- No. of major overhauls per year
unit 0.96 0.51 0.34 0.18 Time for major overhauls per year days 14.4 7.9 4.4 2.7 Intermediate overhauls per year unit 1.92 1.54 0.68 0.36 Time under intermediate overhauls days 11.5 9.2 3.5 2.2 Scheduled maintenances per year unit 10.67 10.67 6.86 4.86 Time under scheduled maint. days 21.3 21.3 11.9 9.7 Total maintenance time per year days 47.3 38.2 19.8 14.6 %age of loco fleet under maint. % 15% 12% 6% 5% Number of locos to cover maint. theory 1.18 1.08 0.43 0.23 Number of locos to cover maint. actual 2 2 1 1
SLIDE 29
Estimating Rolling Stock Requirements – 4
Summary of Loco Requirements
Estimating Rolling Stock Requirements – 4
Summary of Loco Requirements Minimum number of trains in transit unit 5 6 4 3 Minimum number of locos/trains at loading station unit 1 1 1 1 Number of locos at unloading station unit 2 2 2 1 Number of locos to cover maintenance actual 2 2 1 1 Stand-by locos to cover breakdown etc est’d 3 3 2 1 Total Loco Fleet Required unit 13 14 10 7
NB The number of standby locomotives takes into account the difference between the actual number of locos provided to cover maintenance & the theoretical number required.
SLIDE 30
Summary of Wagon Requirements Summary of Wagon Requirements QJ 8AT DF4 SS3 Number of trains in transit unit 5 6 4 3 Number of trains at loading station unit 1 1 1 1 Number of trains at unloading station unit 2 2 2 1 Number of trains to cover maintenance est’d 1 1 1 1 Total number of trains required unit 9 10 8 6 Number of wagons per train unit 40 34 50 67 Total Wagon Fleet Required unit 360 340 400 402
SLIDE 31 Locomotive Cost Comparisons
- Estimate capital cost (including locomotive
infrastructure requirements), and amortization period;
- Estimate annual maintenance costs;
- Estimate labour costs associated with loco operation &
servicing;
- Estimate water costs for steam locos, including
treatment chemicals;
- Estimate fuel consumption and compare with recorded
data;
Locomotive Cost Comparisons
- Estimate capital cost (including locomotive
infrastructure requirements), and amortization period;
- Estimate annual maintenance costs;
- Estimate labour costs associated with loco operation &
servicing;
- Estimate water costs for steam locos, including
treatment chemicals;
- Estimate fuel consumption and compare with recorded
data;
SLIDE 32 Estimating Capital Costs
- Steam loco fuelling and servicing facilities –
estimated price $4 million;
- Diesel loco fuelling and servicing facilities –
estimated price $2 million;
- Electric loco servicing facilities – estimated price $1 million;
- Electrical infrastructure - $530,000 per km (from Chinese data)
- DF4-D and SS-3 cost including shipping ~ $1.25 million
(quoted)
- QJ cost including reconditioning and shipping ~ $0.4 million
(quoted)
- 8AT steam loco (built in China or similar) ~ $2.5 million
(estimated) Note: Unit cost of 8AT locomotives includes a margin to cover the cost of design, building and testing of a prototype loco.
Estimating Capital Costs
- Steam loco fuelling and servicing facilities –
estimated price $4 million;
- Diesel loco fuelling and servicing facilities –
estimated price $2 million;
- Electric loco servicing facilities – estimated price $1 million;
- Electrical infrastructure - $530,000 per km (from Chinese data)
- DF4-D and SS-3 cost including shipping ~ $1.25 million
(quoted)
- QJ cost including reconditioning and shipping ~ $0.4 million
(quoted)
- 8AT steam loco (built in China or similar) ~ $2.5 million
(estimated) Note: Unit cost of 8AT locomotives includes a margin to cover the cost of design, building and testing of a prototype loco.
SLIDE 33
Estimating Capital Costs Estimating Capital Costs
Capital Cost and Depreciation Estimates units QJ 8AT DF4 SS3 Electrical infrastructure cost $m 61.3 Servicing infrastructure cost $m 4.0 4.0 2.0 1.0 Number of locomotives required unit 13 14 10 7 Cost per locomotive $m 0.40 2.5 1.25 1.25 Cost of locomotive fleet $m 5.20 35.0 12.0 8.40 Depreciation period for infrastructure years 25 25 25 25 Depreciation period for locos years 10 25 25 25 Amortized cost of infrastructure $m/year 0.160 0.160 0.080 2.493 Amortized cost of locomotives $m/year 0.520 1.400 0.480 0.360 Total Amortization Cost of Traction $m/year 0.680 1.560 0.560 2.829
SLIDE 34
Estimating Loco Maintenance Costs Estimating Loco Maintenance Costs
Units QJ 8AT DF4 SS3 Major overhaul frequency Km 250,000 500,000 700,000 1.2m Major overhaul cost $ 45,000 50,000 230,000 287,500 Intermediate overhaul frequency Km 83,000 125,000 233,000 400,000 Intermediate overhaul cost $ 25,000 25,000 57,500 74,750 Regular maintenance frequency Km 22,500 24,000 30,000 40,000 Regular maintenance cost $ 5,000 5,000 11,500 13,800 Average loco km per year Km 111,000 123,000 115,200 123,400 Major maint cost / loco / year $ 19,900 12,300 37,800 29,600 Intermediate maint cost / loco / year $ 16,600 16,500 14,200 11,500 Regular maint cost / loco/ year $ 24,600 25,700 44,100 42,600 Total maint cost / loco / year $ 61,100 54,500 96,200 83,700 Number of locos in fleet Unit 13 14 10 7 Total cost of maint. per year $m 0.795 0.763 0.962 0.586
SLIDE 35 Estimating Labour Costs
(locomotive operation and servicing)
- Each operating steam loco will require 2 operators;
- Each operating diesel and electric loco will require 1 operator;
- “Old steam” traction will require 8 people for locomotive
servicing duties;
- “Modern steam” traction will require 4 people for locomotive
servicing duties;
- Diesel traction will require only 2 servicemen at the servicing
depot;
- Electric traction will require 6 servicemen, including 2 at the
servicing depot and one linesman in each section of track between passing loops;
- Operating & servicing personnel will cost $5,000 per annum.
Estimating Labour Costs
(locomotive operation and servicing)
- Each operating steam loco will require 2 operators;
- Each operating diesel and electric loco will require 1 operator;
- “Old steam” traction will require 8 people for locomotive
servicing duties;
- “Modern steam” traction will require 4 people for locomotive
servicing duties;
- Diesel traction will require only 2 servicemen at the servicing
depot;
- Electric traction will require 6 servicemen, including 2 at the
servicing depot and one linesman in each section of track between passing loops;
- Operating & servicing personnel will cost $5,000 per annum.
SLIDE 36
Estimating Labour Costs
(for locomotive operation and servicing)
Estimating Labour Costs
(for locomotive operation and servicing)
QJ 8AT DF4 SS3 Labour shifts per day 3 3 3 3 Crew members per loco 2 2 1 1 Number of locos in operation 8 9 7 5 Total loco crew 48 54 21 15 Servicing crew per shift 8 4 2 6 Total servicing crew 24 12 6 18 Total labour requirement 72 66 27 33 Unit labour cost per annum ($) 5,000 5,000 5,000 5,000 Labour cost per annum ($M) 0.360 0.330 0.135 0.165
SLIDE 37
Estimating Annual Water Costs - Summary Estimating Annual Water Costs - Summary Item Units QJ 8AT Water consumption Loaded Journey tonne 30 22 Water consumption Empty Journey tonne 22 16 Total water consumption per round trip tonne 52 38 Number of round trips per year unit 7,143 8,403 Total Water Consumed tonne 371,863 320,753 Water cost including treatment $/t 1.30 1.30 Total Water Cost including treatment $m 0.483 0.417
SLIDE 38 Estimating cost per kWh of energy output
for each traction type
- Coal has a NAR calorific value of 6500 kcal/kg;
- Calorific value for diesel is the standard 10,200 kcal/kg;
- Representative drawbar thermal efficiencies used for each
traction type;
- “Fuel consumption” of electric loco = kWh consumed / kWh
supplied;
- Electrical losses from the point of supply to the loco drawbar =
20%;
- Unit cost for electric power $0.08 per kWh and $1000 per
tonne for diesel fuel;
- Ex-mine coal price = $30 per tonne.
Note: Export coal price is not used because it includes costs
- f loading, transportation, storage, blending, loading onto ship,
plus profit, which do not apply to coal used for locomotive fuel. Estimating cost per kWh of energy output
for each traction type
- Coal has a NAR calorific value of 6500 kcal/kg;
- Calorific value for diesel is the standard 10,200 kcal/kg;
- Representative drawbar thermal efficiencies used for each
traction type;
- “Fuel consumption” of electric loco = kWh consumed / kWh
supplied;
- Electrical losses from the point of supply to the loco drawbar =
20%;
- Unit cost for electric power $0.08 per kWh and $1000 per
tonne for diesel fuel;
- Ex-mine coal price = $30 per tonne.
Note: Export coal price is not used because it includes costs
- f loading, transportation, storage, blending, loading onto ship,
plus profit, which do not apply to coal used for locomotive fuel.
SLIDE 39 Estimating cost per kWh of energy output for each traction type Estimating cost per kWh of energy output for each traction type Units QJ 8AT DF4 SS3 Energy Conversion Factor kcal/kW- h 860 860 860
Efficiency % 8% 15% 30%
Thermal Efficiency % 6% 10% 25% 80% Fuel Calorific Value Kcal/kg 6,500 6,500 10,200
Kg/kWh 2.205 1.323 0.337 1.250 Fuel Cost per tonne $/t $30 $30 $1000 $0.08 Cost of Fuel per kW-h of loco’s output US cents 4.41 2.65 23.61 10.00
SLIDE 40 Estimating Fuel Costs per Annum Estimating Fuel Costs per Annum
Units QJ 8AT DF4 SS3 Annual Tonnage Throughput m.t 20 20 20 20 Distance hauled km 100 100 100 100 Total net million tonne-km per year m.t-km/y 2,000 2,000 2,000 2,000 Gross wagon weight t 93 93 93 93 Net wagon weight t 70 70 70 70 Ratio gross to net tonnes
1.33 1.33 1.33 Total million tonne-km per year (full) m.t-km/y 2,657 2,657 2,657 2,657 Fuel consumption per million tonne-km t or kWh 18.39 11.04 2.81 10,426 Total fuel consumed hauling full trains t or kWh 48,871 29,322 7,474 27.7m Total million tonne-km per year (empty) m.t-km/y 657 657 657 657 Fuel consumption per million tonne-km t or kWh 52.24 31.34 7.99 29,614 Total fuel consumed hauling empty trains t or kWh 34,330 20,598 5,250 19.5m Total fuel consumed-full & empty trains t or kWh 83,201 49,921 12,725 47.2m Cost of Fuel per tonne or kWh $ 30 30 1000 0.08 Cost of Fuel per year of operation $m 2.496 1.498 12.725 3.773
SLIDE 41 Comparison of Overall Costs per Annum
Notes: 1: Electrical costs exclude maintenance of electrical infrastructure; 2: Extra capital cost of 8AT vs. diesel will be recovered within 3½ years. 3: 8AT costs are likely to be lower than those assumed in this study
Comparison of Overall Costs per Annum
Notes: 1: Notes: 1: Electrical costs exclude maintenance of electrical infrastructur Electrical costs exclude maintenance of electrical infrastructure; e; 2: Extra capital cost of 2: Extra capital cost of 8AT vs. diesel will be recovered within 3 8AT vs. diesel will be recovered within 3½ ½ years. years. 3: 8AT costs are likely to be lower than those assu 3: 8AT costs are likely to be lower than those assumed in this study med in this study
Units QJ 8AT DF4 SS3 Amortized Cost of Locos and servicing infrastructure: $m 0.680 1.560 0.560 2.829 Total cost of maintenance $m 0.795 0.763 0.962 0.586 Labour cost $m 0.360 0.330 0.135 0.165 Total water cost incl. treatment $m 0.483 0.417 nil nil Total fuel cost $m 2.496 1.498 12.725 3.773 Total Operating Cost per Year $m 4.815 4.568 14.382 7.353 Cost per tonne of freight hauled $/t 0.24 0.23 0.72 0.37 Cost per million-net-tonne-km $/mt-km 2.407 2.284 7.191 3,677 Cost ratio compared to 8AT option % 105%
161% Cost difference compared to 8AT $m 0.246
2.785
SLIDE 42 Sensitivity of Cost Assumptions on Cost Comparisons
Annual costs in $ million. 1: Even with $25 per tonne “carbon tax”, the 8AT would remain cheaper than
2: Diesel costs are very sensitive to fuel prices, because they are largest
- component. Diesel traction costs are likely to escalate much more rapidly than
steam’s.
Sensitivity of Cost Assumptions on Cost Comparisons
Annual costs in $ million. 1: Even with $25 per tonne 1: Even with $25 per tonne “ “carbon tax carbon tax” ”, the 8AT would remain cheaper than , the 8AT would remain cheaper than
- ther options.
- ther options.
2: Diesel costs are very sensitive to fuel prices, because they 2: Diesel costs are very sensitive to fuel prices, because they are largest are largest
- component. Diesel traction costs are likely to escalate much mor
- component. Diesel traction costs are likely to escalate much more rapidly than
e rapidly than steam steam’ ’s. s. QJ 8AT DF4 SS3 Calculated Operating Cost per annum 4.815 4.568 14.382 7.353 Doubling of labour costs to $10,000 p.a. 5.174 4.897 14.516 7.518 Doubling of water cost to $2.60 per tonne 5.186 4.888 14.382 7.353 Doubling steam locomotive maintenance costs 5.609 5.331 14.382 7.353 Doubling steam loco and infrastructure capital cost 5.495 6.128 14.382 7.353 Doubling steam locomotive fuel cost (to $60 per t) 7.310 6.065 14.382 7.353 50% increase in price of diesel (to $1050 per t) 3.983 4.069 20.744 7.353
SLIDE 43 Conclusions Conclusions
- 1. Steam traction is a technically viable option for coal haulage,
especially where gradients are not steep;
- 2. Steam traction is (by a substantial margin) the most cost-
competitive option for haulage of coal where coal and labour costs are low;
- 3. Steam’s cost advantage is insensitive to large changes in cost
assumptions;
- 4. Diesel’s costs are highly sensitive to increases in fuel costs
which are likely to occur in the future;
- 5. Modern steam offers the lowest operating costs, and its cost
advantage will increase as fuel and labour costs rise.
- 6. Steam’s cost advantage is enhanced by the smaller wagon
fleet that is needed, and by haulage of shorter trains;
- 7. Further study is needed in some areas.
SLIDE 44
Switzerland UK South Africa Switzerland UK South Africa New Steam Locos can be built in 21st Century
SLIDE 45 Sincere thanks to:
- Railway Technical Society of Australasia
- EECW Pty Ltd
- Brian McCammon (New Zealand)
- Alan Fozard and John Hind (UK)
- Hugh Odom (USA)
Please contact me for further information. www.5at.co.uk
Sincere thanks to:
- Railway Technical Society of Australasia
- EECW Pty Ltd
- Brian McCammon (New Zealand)
- Alan Fozard and John Hind (UK)
- Hugh Odom (USA)
Please contact me for further information. www.5at.co.uk
SLIDE 46