Why is macroeconomic environment import to consumers? The - - PDF document

why is macroeconomic environment import to consumers
SMART_READER_LITE
LIVE PREVIEW

Why is macroeconomic environment import to consumers? The - - PDF document

Why is macroeconomic environment import to consumers? The macroeconomic environment refers to the big economic environment we as individuals cannot control. Nevertheless we are affected by the national economic environment. Inflation


slide-1
SLIDE 1

1

Why is macroeconomic environment import to consumers?

The macroeconomic environment refers to the big economic environment we as individuals cannot control. Nevertheless we are affected by the national economic environment.

Inflation rate, unemployment rate, housing market ups

and downs While we cannot directly influence these

macroeconomic changes, we can anticipate these changes, know their effects, and cope with them.

2

Business Cycle or Economic Cycle

What is a business cycle or an economic cycle?

The economy goes through irregular ups and downs.

There are four stages to each up and down cycle: peak, contraction, trough, and expansion.

Peak: The height of economic prosperity Contraction: Economy goes down Trough: Worst of times Expansion: Prosperity returns

A business cycle (economic cycle) is one complete

movement from peak to peak (or trough to trough)

3

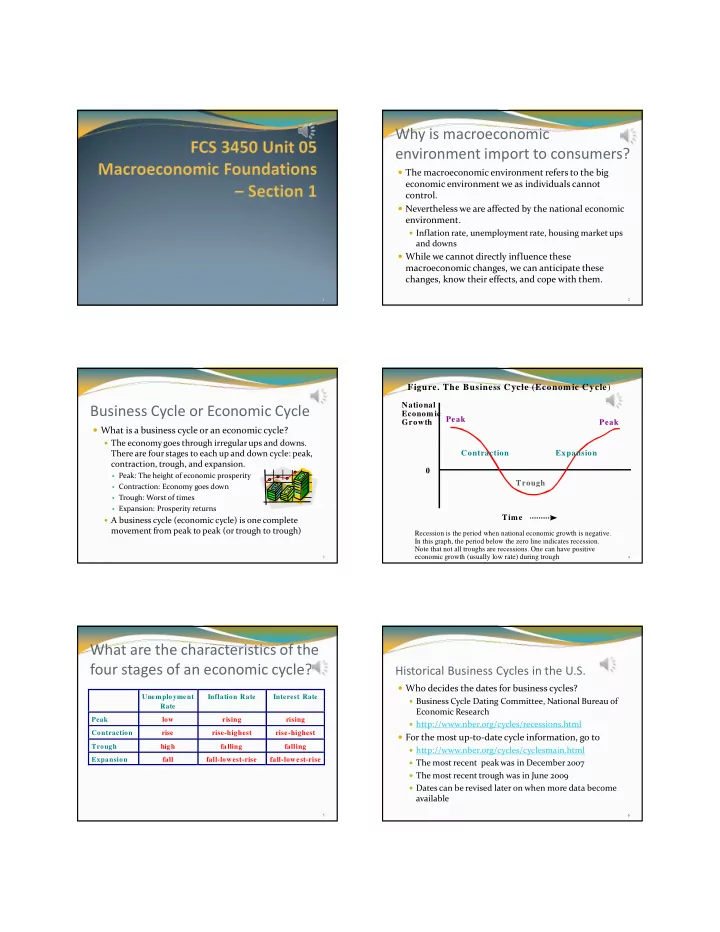
  • Figure. The Business Cycle (Economic Cycle)

National Economic Growth Time Peak Peak Contraction Expansion Trough

Recession is the period when national economic growth is negative. In this graph, the period below the zero line indicates recession. Note that not all troughs are recessions. One can have positive economic growth (usually low rate) during trough

4

Unemployment Rate Inflation Rate Interest Rate Peak low rising rising Contraction rise rise-highest rise-highest Trough high falling falling Expansion fall fall-lowest-rise fall-lowest-rise

What are the characteristics of the four stages of an economic cycle?

5

Historical Business Cycles in the U.S.

Who decides the dates for business cycles?

Business Cycle Dating Committee, National Bureau of

Economic Research

http://www.nber.org/cycles/recessions.html

For the most up-to-date cycle information, go to

http://www.nber.org/cycles/cyclesmain.html The most recent peak was in December 2007 The most recent trough was in June 2009 Dates can be revised later on when more data become

available

6

slide-2
SLIDE 2

How regular are business cycles?

Business cycles are not equal in length.

One business cycle (peak to peak measure) can last as

short as 17 months (January 1920- July 1921), to as long as 128 months (July 1990 – March 2001). Business cycles are recurrent, but not regular.

7

What is the most important measure of economic activity?

The Business Cycle Dating Committee views real GDP as the single best measure of aggregate economic activity. In determining whether a recession has occurred and in identifying the approximate dates of the peak and the trough, the committee places considerable weight

  • n the estimates of real GDP issued by the Bureau of

Economic Analysis of the U.S. Department of Commerce.

8

What is GDP?

GDP is Gross domestic product – sales value of all final goods and services produced in the economy in a given time period.

GDP = consumption + investment + government

spending + (exports − imports) GDP can be presented in both current dollars and

constant dollars (to adjust for inflation).

9

What’s the current GDP level?

U.S. GDP data:

In 2013 U.S. GDP was 16,768.1 billions in current dollars

(15,710.3 billions in 2009 dollars)

In comparison: In 2000, U.S. GDP was 10,284.8 billions

(12,557.9 billions in 2009 dollars) Where to get GDP information?

Bureau of Economic Analysis of the Dept. of Commerce

at

http://www.bea.gov/national/index.htm#gdp

10

How is U.S. GDP compared to other countries?

For a comparison of overall GDP, click this web link:

https://www.cia.gov/library/publications/the-world-

factbook/rankorder/2001rank.html

U.S. is ranked #1 in total GDP, followed by the European

Union and China. For a comparison of per capita GDP

(GDP/population), click this web link:

https://www.cia.gov/library/publications/the-world-

factbook/rankorder/2004rank.html

U.S. is ranked #14 in per capita GDP.

11

Some Implications for Consumers

When in the cycle is a good time to borrow money?

Interest rate is the lowest during the early part of

expansion. When in the cycle is a good time to graduate and find a

job?

Your best luck is at the peak and the worst luck is at the

trough.

12

slide-3
SLIDE 3

Can one predict business cycles?

Can one predict business cycles?

No one yet has perfected a flawless method for forecasting

business cycles.

How long a stage will take varies cycle by cycle.

But there are some business cycle indicators we can look at

Leading indicators: Economic factors that change before the

economy starts to follow a particular pattern or trend.

Coincident indicators: Economic factors that vary directly

and simultaneously with the business cycle, thus indicating the current state of the economy.

Lagging indicators: Economic factors that change after the

economy has already begun to follow a particular pattern or trend.

13

What’s included in Leading Indicators

Average weekly hours, manufacturing Average weekly initial claims for unemployment insurance Manufacturers' new orders, consumer goods and materials Vendor performance, slower deliveries diffusion index Manufacturers' new orders, non-defense capital goods Building permits, new private housing units Stock prices, 500 common stocks Money supply, M2 Interest rate spread, 10-year Treasury bonds less federal funds Index of consumer expectations

14

What’s included in Coincident Indicators?

Employees on nonagricultural payrolls Personal income less transfer payments Industrial production Manufacturing and trade sales

15

What’s included in Lagging Indicators?

Average duration of unemployment Inventories to sales ratio, manufacturing and trade Labor cost per unit of output, manufacturing Average prime rate Commercial and industrial loans Consumer installment credit to personal income ratio Consumer price index for services

16

For more information on leading, coincident, and lagging indicators visit http://www.conference- board.org/data/bcicountry.cfm?cid=1

17

The Cause of Inflation

A modern economy is characterized by exchanges. There are many explanations as to what causes

  • inflation. The one that is supported the most is a

money supply explanation. In order to understand this explanation, we need to know how our current money system was developed.

18

slide-4
SLIDE 4

The History of Development of Our Current Money System

Stage 1. In the early days a Barter system was developed when people realize that efficiency can be gained when people specialize and trade.

Barter means trading on a product-for-product basis.

Disadvantages of a barter system: High time cost: Not only

must a barter find someone who wants the product that the barterer has to offer, but that same person must also have some product the barterer wants. Furthermore, such searches must be conducted for all products necessary to one's living.

19

Stage 2. Exchange tickets – work like an I-

  • we-you. They are accepted by everyone

in the community as payment for a product or services.

Earlier days, people use precious metals

(gold and/or silver) as exchange tickets.

In modern economy, we use currency

(paper dollars, coins) and checking accounts.

20

Stage 3: Then early banks developed.

First, there was fee for deposit - Receipts of these

deposits can be used as a form of money

Then bankers realized that they can loan a fraction of

the bank’s total deposits to earn interest so bank loans started.

Two problems developed in this early banking system:

(1) Lack of uniform money (2) Bank failures - Failure occurs if a bank cannot meet the

demands of its depositors. There was no one for the bank to turn to for help if a large amount is drawn by the depositors and the bank does not have enough cash on hand (bank run).

21

Stage 4: To address the problems with the early bank system, the Federal Reserve (Fed) was established in 1913 in the United States. The Fed is an independent government agency whose Board

  • f Governors is appointed by the President with

the consent of the Senate.

The major goals of the Fed are:

(1) Serving as the lender of last resort to the private banks (2) Issuing a common, uniform currency (3) Establishing and enforcing regulations regarding the

proportion of deposits which banks must keep "on hand" to meet depositors' demands (reserve requirement)

(4) Controlling the supply of money to the economy.

The latter two functions are of particular interest to us in

understanding the reasons for inflation.

22

What is Fractional-Reserve Banking?

Fractional reserve banking

Only a fraction of a bank's deposits (reserves) needs to be kept on

hand -the rest can be loaned to borrowers.

These loans in essence are an increase in the money supply because

they are an expansion of the original deposits at the bank.

The table below shows an example: Table: Private Bank Account Assets Liabilities (a) 100 paper dollars deposited 100 checking account dollars (b) Borrower's IOU worth $300 300 checking account dollars lent

23

How does The Fed Manipulate Money Supply?

Two traditional methods:

Changing minimum reserve requirement: Altering the rate at which

banks create loans

Increase reserve requirement: decrease money supply Decrease reserve requirement: increase money supply

Directly changing bank's cash reserve by buying Treasury Bills (TBs)

from banks or selling TBs to banks through open market operation.

Buy: increase money supply Sell: decrease money supply

The second method is more commonly used than the first method. Recently (after the 2007-2008 financial crisis) the Fed extended its purchases to include a variety of debt instruments -> further increasing money supply.

24

slide-5
SLIDE 5

The Relationship between Money Supply and the Real Value of Money

Over-supply of money leads to inflation

Money is just a medium of exchange. To facilitate exchanges in the

economy, the supply of money should grow at a rate comparable to the growth of exchanges of economy, and therefore should grow at about the same rate as the economy is growing. When the supply of money grows faster than the rate of the

economic growth, we have inflation

Example:

Suppose we only have one product in the economy, and the country

produces a total of 1 million units of this product. Money supply is $1 million.

Unit price is $1million/1 million product = $1.00 per product Now suppose the second year, the economy grows to a production of 1.2

million, but money supply is increased to 1.5 million.

New price = 1.5 million/1.2 million= $1.25 per product We have an inflation rate of 25% in this example (1.25/1.00-1) 25

Does The Effect of Money Oversupply show immediately?

  • No. This process does take time. A good estimate is

that it takes two years for excessive money growth to lead to higher inflation. Why doesn’t the Fed just supply less money?

If money is undersupplied, it can hinder the economy.

The problem of undersupplying money is much worse than the problem of oversupplying money. Given the uncertain in the future (remember it takes two years for the effect to happy), it is much better to err on the

  • versupply side.

26

How Might We Predict Inflation Rate?

Knowing the cause of inflation, we have a way to predict future inflation rate.

A rough way: Excess money growth equals to inflation Given there is a two-year delay, we use a two-year lag

model.

Predicted inflation rate in year A = Money supply growth rate

in year (A-2) - Economy growth rate in year A

27

Beginning of Money Supply(M2 in billions), Jan. GDP Growth Rate (w/o inflation adj.) 2005 6388.8 6.5% 2006 6691.6 6.0% 2007 7077.5 4.9% 2008 7483.6 1.9% 2009 8252.9

  • 2.2%

2010 8438.4 2.4% 2011 8830.1 1.8% 2012 9749.4 4.2% 2013 10,446.0 3.7% 2014 11,025.7

Example:

Predict the inflation rate in 2008 and 2009 given the following information.

28

M2: http://www.federalreserve.gov/datadownload/Choose.aspx?rel=H.6 GDP growth rate: http://www.bea.gov/national/index.htm#gdp

Answer: Money supply growth rate (two year lag):

For 2008 inflation prediction we need 2006 money supply

growth rate. It was 2007M2/2006M2-1=7077.5/6691.6-1=5.8%

For 2009 inflation prediction we need 2007 money supply

growth rate. It was 2008M2/2007M2-1=7483.6/7077.5-1=5.7% Predicted inflation rate:

2008 predicted inflation = Money supply growth rate for 2006

– Economy growth rate for 2008 =5.8%-1.9%=3.9%

2009 predicted inflation= Money supply growth rate for 2007

– Economy growth rate for 2009=5.7%- (-2.2%)=7.9%

29