SLIDE 7 7 Cost of overcrowding: summary of cow responses
Changes in these
behaviors:
Greater aggression &
displacements at feed bunk
Greater feeding rate Reduced resting time Increased idle
standing in alleys
Decreased rumination Subordinate (i.e.
primiparous and lame cows) most affected
May result in these
economic losses:
Less milk yield Lower milk fat Greater SCC More health disorders Increased lameness Fewer cows pregnant
Effect on Cost
What is optimal stocking density?
Close-up and fresh: ≤80% of bunk
space (30 in/cow)
May be a function of stall availability
Lactating cows
4-row barn: don’t exceed 115-120% of
stalls
Mixed heifer & older cows: 100%
6-row barn: 100% of stalls?
Ensure access to feed, water, stalls
Ensure access to feed, water, stalls
Territoriality in Free Stalls: SR from Heifer’s Perspective
(Friend and Polan, 1974)
Cows display territoriality in
use of free stalls
Social rank determines priority Stalls nearest the feed alley
preferred (Gaworski et al., 2003)
Subordinate cows avoid free
stalls previously occupied by dominant cows
Overcrowded conditions (from
subordinate perspective) may exist even at lower stocking densities
Rumination by primiparous cows in preferred/less preferred stalls
(Krawczel, 2007) 0.05 58.4 35.2 % resting time spent ruminating 0.09 147.8 81.4 Rumination time, min/d P value Less preferred Preferred
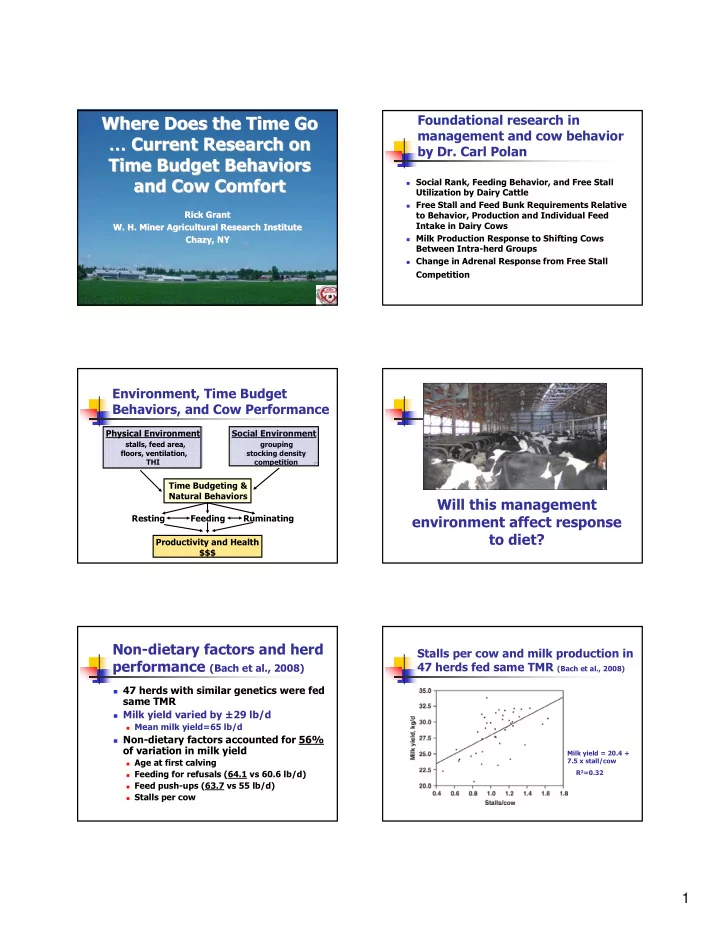
Physical and Social Environment Interact
Heat Stress Overcrowding Reduced rumination Increased sorting Increased feeding rate Increased standing Acidosis Low fat % Lameness
TIME BUDGET EVALUATOR
Farm Name: A1 Dairy Date: 25-Feb-10 Group of cows: High cows Time Activity Time (h) Remaining (h)
24-h day MilkingA 5.2 18.8 TreatmentB 0.0 18.8
"Standard " Time for Activities (h) Eating 5 13.8 5.3 Drinking 0.5 13.3 0.5 Standing & OtherD 3.0 10.3 3.0
- 3. Adjustment to Standing for Stocking Rate
Enter cows in pen: 100 Enter number of useable stalls: 100 Stocking rate (%): 100% Adjusted standing time (h): 3 10.3 Standing time increases above 120% stock rate
- 4. Resting (Lying) Time Available
10.3
- 5. Adjustment to Resting (h) for Stocking Rate
10.3 Lying time reduced above 120% stocking rate Average Cow Elite Cow
- 6. Resting Requirement (h/day)
11.5 13.5 "Elite" cows are top-10% by milk yield.
- 7. Resting Required - Resting Time Provided (h)
1.2 3.2 Impact of Resting Activity: Average cow Elite Cow Milk loss min
pounds milk/cow/day Milk loss max
pounds milk/cow/day Energy value
Mcal NEL/cow/day Body weight loss
pounds/cow/day Body condition loss
Score change in 100 days
AEnter time spent in transit to parlor, holding area, in parlor being milked, and time to travel back to pen. BTime spent at management rail or elsewhere outside of pen. CEnter times measured for your herd for eating and drinking, or use "standard" measures in column at right. DIncludes standing in alleys/stalls, grooming, fighting, estrous activity, idling, etc.
Stocking Rate (SR) and Milk Loss - Primiparous Grouped with Multiparous Cows: Note: milk loss expressed as difference between multi- and primiparous cows <120% SR 0 lb/d For SR<120%, no loss in milk yield expected. 120-130% SR Check other SR Expect loss of 7.7 lb/d for primi versus multiparous cows. 130-140% SR Check other SR Expect loss of 14.9 lb/d for primi versus multiparous cows. >140% SR Check other SR Expect loss of 8.8 lb/d for primi versus multiparous cows. At 140% SR, milk yield of both multi and primiparous cows declines. Stocking Rate (SR) and Milk Loss - Note: milk loss expressed as difference between healthy (locomotion Lame versus Healthy CowsA score 1 and 2) and lame cows (score 3 and 4). <120% SR 0 lb/d For SR<120%, no loss in milk yield expected. 120-130% SR Check other SR Expect loss of 2 to 11 lb/d for lame versus healthy cows in mixed groups. 130-140% SR Check other SR Expect loss of 16 to 26 lb/d for lame versus healthy cows in mixed groups. >140% SR Check other SR Expect loss of 14 to 23 lb/d for lame versus healthy cows in mixed groups.
AMilk yield loss for primi and multiparous, lame and nonlame cows predicted from Hill (2006).
www.whminer.org