
SLIDE 1
w w w .farm docdaily.illinois.edu w w w .farm doc.illinois.edu
What Is Up with Soybean Yields?
Scott Irwin
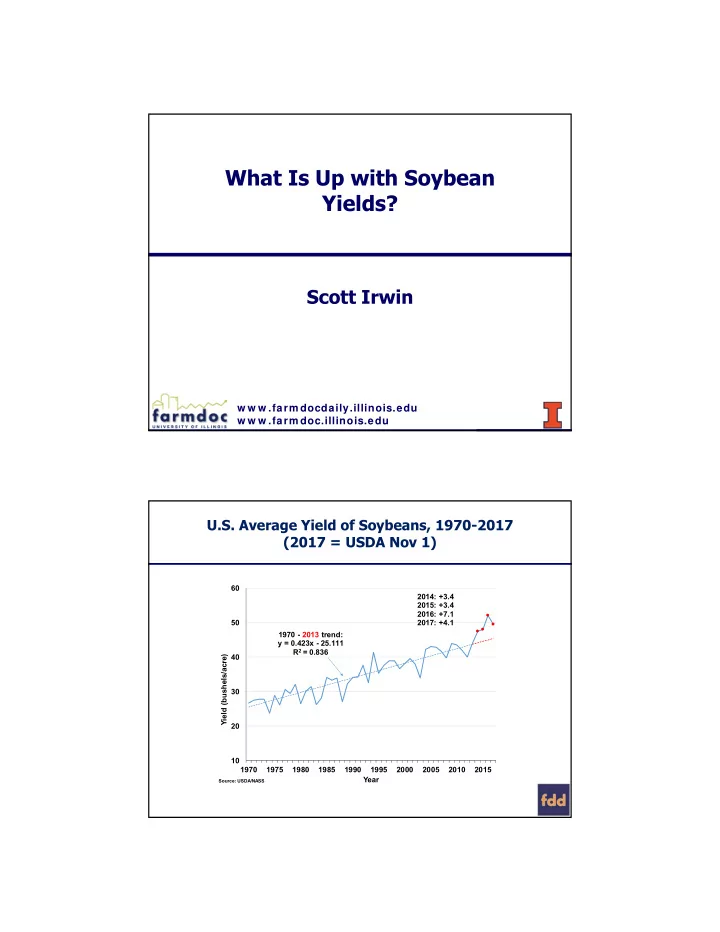
U.S. Average Yield of Soybeans, 1970-2017 (2017 = USDA Nov 1)
10 20 30 40 50 60 1970 1975 1980 1985 1990 1995 2000 2005 2010 2015 Yield (bushels/acre) Year
Source: USDA/NASS
1970 - 2013 trend: y = 0.423x - 25.111 R2 = 0.836 2014: +3.4 2015: +3.4 2016: +7.1 2017: +4.1