
SLIDE 1
What Happened to the Dinosaurs?
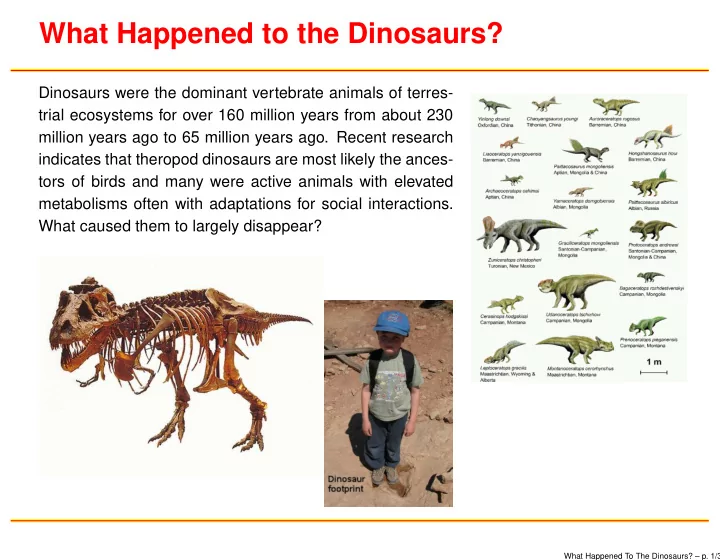
Dinosaurs were the dominant vertebrate animals of terres- trial ecosystems for over 160 million years from about 230 million years ago to 65 million years ago. Recent research indicates that theropod dinosaurs are most likely the ances- tors of birds and many were active animals with elevated metabolisms often with adaptations for social interactions. What caused them to largely disappear?
What Happened To The Dinosaurs? – p. 1/3