What drives carbon exchange between a temperate sclerophyll forest - - PowerPoint PPT Presentation

what drives carbon exchange between a temperate
SMART_READER_LITE
LIVE PREVIEW

What drives carbon exchange between a temperate sclerophyll forest - - PowerPoint PPT Presentation

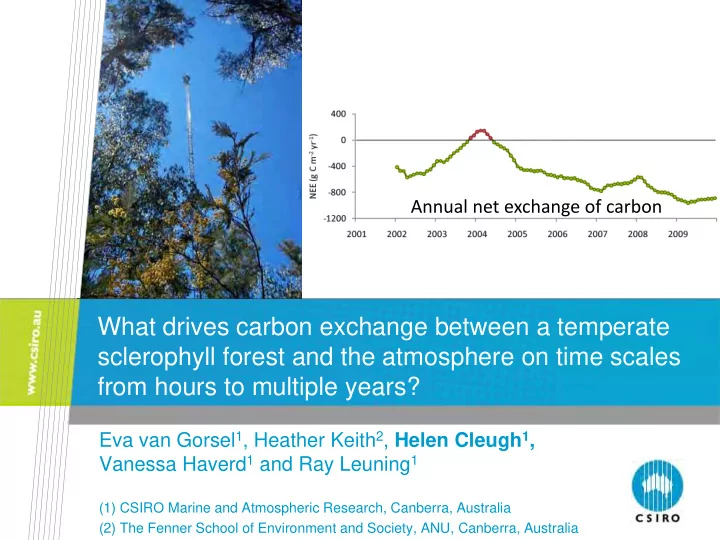
Annual net exchange of carbon What drives carbon exchange between a temperate sclerophyll forest and the atmosphere on time scales from hours to multiple years? Eva van Gorsel 1 , Heather Keith 2 , Helen Cleugh 1 , Vanessa Haverd 1 and Ray


slide-1
SLIDE 1

Eva van Gorsel1, Heather Keith2, Helen Cleugh1, Vanessa Haverd1 and Ray Leuning1

(1) CSIRO Marine and Atmospheric Research, Canberra, Australia (2) The Fenner School of Environment and Society, ANU, Canberra, Australia

What drives carbon exchange between a temperate sclerophyll forest and the atmosphere on time scales from hours to multiple years?

Annual net exchange of carbon

slide-2
SLIDE 2
  • CSIRO. TEMPORAL VARIABILITY IN CO2 EXCHANGE

Variability of NEE, FLUXNET

From: D. Baldocchi, 2008, Aust. J. of Botany Tumbarumba min: -963 g C m-2 yr-1 Carbon uptake max: 145 g C m-2 yr-1 Carbon efflux

Published measurements of annual net ecosystem exchange of CO2 (NEE) in a range of global ecosystems

slide-3
SLIDE 3
  • CSIRO. TEMPORAL VARIABILITY IN CO2 EXCHANGE

Tumbarumba Site: Part of OzFlux

OzFlux

Tumbarumba Flux Tower in SE highlands of NSW Bago State Forest

slide-4
SLIDE 4

Tumbarumba Site: Topography

  • CSIRO. TEMPORAL VARIABILITY IN CO2 EXCHANGE
  • 40 m tall Eucalypt forest with a Leaf Area Index ~ 2.4
  • Alpine Ash E. Delegatensis
  • Mountain White Gum E. dalrympleana
  • Forest cover and species homogenous within radius > 5 km
  • Shallow basin sloping towards North

Photographs : Dale Hughes

slide-5
SLIDE 5
  • Direct measure of CO2 and water

vapour fluxes between the canopy and the atmosphere

–Water (λE, ET) and CO2 (NEE)

  • Energy fluxes

–Radiation (Q) and heat (H, G)

  • Above canopy, spatially-averaged
  • ver an area ~ 1 – 5 km
  • Continuous – hourly to multi-annual

H

Measuring ecosystem water and carbon fluxes

NEE

ET

Q G

ET Q

slide-6
SLIDE 6
  • CSIRO. TEMPORAL VARIABILITY IN CO2 EXCHANGE

Climate at Bago State Forest (AWAP data)

1380 mm 22.7 °C

  • 1.09 °C
slide-7
SLIDE 7
  • CSIRO. TEMPORAL VARIABILITY IN CO2 EXCHANGE

Temperature / precipitation measured at site

slide-8
SLIDE 8
  • CSIRO. TEMPORAL VARIABILITY IN CO2 EXCHANGE

Ecosystem carbon fluxes vary in response to these meteorological drivers ….

slide-9
SLIDE 9
  • CSIRO. TEMPORAL VARIABILITY IN CO2 EXCHANGE

.. and also disturbance

  • J. Verbesselt et al., 2010, Forest Ecol. Manag.

Leaves damaged by insect attack (psyllids) in summer 2002 – 03; severely damaged leaves shed in autumn 2003 2002 2006

slide-10
SLIDE 10

Modelling net ecosystem exchange of CO2 (NEE)

Hyperbolic light-response curve (Michaelis-Menten)

  • canopy light utilization efficiency (μmol C J-1)

b maximum CO2 uptake rate of canopy at light saturation (μ mol C m-2 s-1)

  • terrestrial ecosystem respiration (μmol C m-2 s-1)
slide-11
SLIDE 11
  • CSIRO. TEMPORAL VARIABILITY IN CO2 EXCHANGE

include temperature dependence of respiration include dependence on vapour pressure deficit (VPD) 30 day moving window

Modelling net ecosystem exchange of CO2 (NEE)

slide-12
SLIDE 12
  • CSIRO. TEMPORAL VARIABILITY IN CO2 EXCHANGE

Model performance

Captures diurnal variability …

slide-13
SLIDE 13
  • CSIRO. TEMPORAL VARIABILITY IN CO2 EXCHANGE

Model performance

This means that we can use this model to quantify the effect

  • f each of the meteorological drivers on the components of

the carbon cycle (GPP, RE and NEE)

slide-14
SLIDE 14
  • CSIRO. TEMPORAL VARIABILITY IN CO2 EXCHANGE

Ecosystem assimilation (GPP) 2001-2009

slide-15
SLIDE 15
  • CSIRO. TEMPORAL VARIABILITY IN CO2 EXCHANGE

Ecosystem assimilation (GPP) 2001-2009

slide-16
SLIDE 16
  • CSIRO. TEMPORAL VARIABILITY IN CO2 EXCHANGE

Ecosystem respiration (RE) 2001-2009

slide-17
SLIDE 17
  • CSIRO. TEMPORAL VARIABILITY IN CO2 EXCHANGE

NEE, GPP and RE

slide-18
SLIDE 18
  • CSIRO. TEMPORAL VARIABILITY IN CO2 EXCHANGE

Timescales of variability: Drivers and fluxes [2002-2009]

shortwave incoming radiation soil temperature vapour pressure deficit soil water content leaf area index

slide-19
SLIDE 19
  • CSIRO. TEMPORAL VARIABILITY IN CO2 EXCHANGE

shortwave incoming radiation soil temperature vapour pressure deficit soil water content leaf area index

Timescales of variability: Drivers and fluxes [2002-2009]

slide-20
SLIDE 20
  • CSIRO. TEMPORAL VARIABILITY IN CO2 EXCHANGE

Conclusions / Summary (1)

Highly dynamic forest ecosystem where the CO2 fluxes: Respond mainly to the meteorological drivers:

  • radiation and soil temperature [hourly]
  • radiation and SWC [seasonal]
  • VPD, SWC and radiation [annual]
  • LAI and SWC [multi annual]

Are subject to stress caused by meteorological drivers

  • Drought (low soil moisture → RE / high VPD → GPP)
  • Disturbance – insect predation that is linked to antecedent

weather conditions → GPP

slide-21
SLIDE 21
  • CSIRO. TEMPORAL VARIABILITY IN CO2 EXCHANGE

Conclusions / Summary (2)

The response to these combined stressors resulted in:

  • reduced leaf area
  • reduced stomatal conductance and photosynthetic capacity
  • reduced assimilation
  • reduced biomass increment
  • increased mortality

Effect of disturbance (insects) on ecosystem assimilation is greater than on ecosystem respiration Carbon sink turned to a source for several months

slide-22
SLIDE 22

CSIRO Marine and Atmospheric Research Helen Cleugh Email: helen.cleugh@csiro.au Web: www.cmar.csiro.au

Contact Us Phone: 1300 363 400 or +61 3 9545 2176 Email: enquiries@csiro.au Web: www.csiro.au

Thank you

slide-23
SLIDE 23
  • CSIRO. TEMPORAL VARIABILITY IN CO2 EXCHANGE

… as does tree mortality

2002 – 2005 drought years 1998 – 2001 average rainfall

slide-24
SLIDE 24
  • CSIRO. TEMPORAL VARIABILITY IN CO2 EXCHANGE

… and biomass increment

average rainfall drought years