Welcome to TxDOT webinar: Rio Grande Valley Freight Plan Steering - - PowerPoint PPT Presentation

welcome to txdot webinar rio grande valley freight plan
SMART_READER_LITE
LIVE PREVIEW

Welcome to TxDOT webinar: Rio Grande Valley Freight Plan Steering - - PowerPoint PPT Presentation

Welcome to TxDOT webinar: Rio Grande Valley Freight Plan Steering Committee. Roll call at 8:30 AM. At this time, please ensure your phone and computer microphone are muted. Please take a moment to visit the chat box and say hello to others who


slide-1
SLIDE 1

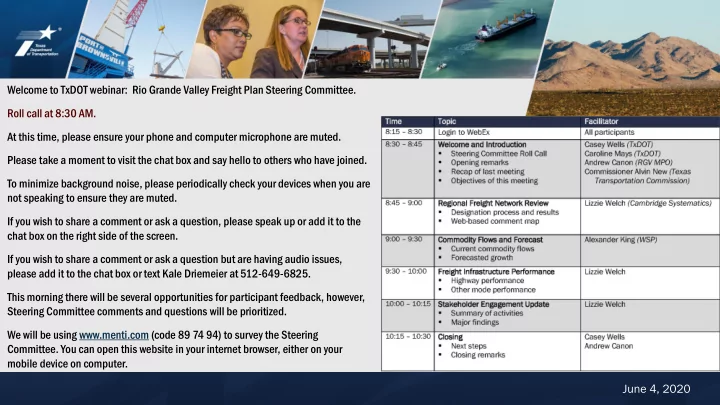
Rio Grande Valley Freight and Trade Transportation Plan June 4, 2020 June 4, 2020 Welcome to TxDOT webinar: Rio Grande Valley Freight Plan Steering Committee. Roll call at 8:30 AM. At this time, please ensure your phone and computer microphone are muted. Please take a moment to visit the chat box and say hello to others who have joined. To minimize background noise, please periodically check your devices when you are not speaking to ensure they are muted. If you wish to share a comment or ask a question, please speak up or add it to the chat box on the right side of the screen. If you wish to share a comment or ask a question but are having audio issues, please add it to the chat box or text Kale Driemeier at 512-649-6825. This morning there will be several opportunities for participant feedback, however, Steering Committee comments and questions will be prioritized. We will be using www.menti.com (code 89 74 94) to survey the Steering

  • Committee. You can open this website in your internet browser, either on your

mobile device on computer.

slide-2
SLIDE 2

Rio Grande Valley Freight and Trade Transportation Plan June 4, 2020

Rio Grande Valley Freight and Trade Transportation Plan

Steering Committee Webinar

June 4, 2020

slide-3
SLIDE 3

Rio Grande Valley Freight and Trade Transportation Plan June 4, 2020

Agenda

3

Welcome and Introduction Regional Multimodal Freight Network Review Commodity Flows and Forecast Freight Infrastructure and Performance Stakeholder Engagement Update 1 2 3 4 5 Next Steps and Wrap-up 6

slide-4
SLIDE 4

Rio Grande Valley Freight and Trade Transportation Plan June 4, 2020

Welcome

4

▪ Project ect Tea eam – Casey Wells, TxDOT Project Manager – Consultant Team: Cambridge Systematics, WSP ▪ Commi mmitt ttee ee Roll ll Call all ▪ Wel elcome come Remar emarks ks – Caroline Mays, Section Director, TxDOT Freight, Trade, and Connectivity – Andrew Canon, Executive Director, RGV MPO – Commissioner Alvin New, Texas Transportation Commission

slide-5
SLIDE 5

Rio Grande Valley Freight and Trade Transportation Plan June 4, 2020

Freight and Trade Plan Purpose and Goals

5

Identify the region’s specific freight and trade-related transportation opportunities, challenges, and strategies impacting the Texas Multimodal Freight Network and statewide economic competitiveness Integrate multimodal regional and statewide international freight transportation considerations into the local and regional transportation planning, programming, and implementation processes Develop a Rio Grande Valley Freight and Trade Transportation Plan that identifies freight and trade transportation activities,

  • pportunities, challenges, and strategies in the region

GOALS PURPOSE

slide-6
SLIDE 6

Rio Grande Valley Freight and Trade Transportation Plan June 4, 2020

Freight Transportation Goals and Objectives for Rio Grande Valley

6

Safety Improve the sa safety ety of the multimodal freight system Economic Competitiveness Enhance economic

  • mic competit

titiv ivenes eness, s, produc ductivit ivity, and developme lopment in the region and beyond Mobility and Reliability Enhance mobili ility and improve system efficienc ency and performance

  • rmance of the transportation system

Connectivity Improve local, regional, and cross-border highway connec ectiv tivit ity as well as connectivity between fr freight ght modes Sustainable Funding Identify su sustai stainabl nable fu fund nding ing sources for the region’s transportation system. Stewardship Manage resources respo sponsibly nsibly and foster account untab abilit ility and transparenc nsparency in decision-making. Customer Service Encourage local l owner ersh ship ip of an f and coordinati ination

  • n by engaging publi

blic and priv ivate e se sector r st stakeholder holders Asset Preservation Ma Mainta tain in and pres eser erve transportation infrastructure that supports movement of freight.

slide-7
SLIDE 7

Rio Grande Valley Freight and Trade Transportation Plan June 4, 2020

7

Recap of Last Meeting

Process

Communicate and refine the process for designating the regional freight network

Criteria

Confirm relevant criteria for freight and trade transportation in the RGV

Scoring

Determine importance of each factor in final network designation ▪ Confirm the process for designating the Regional Multimodal Freight Network, specifically the highway network scoring approach

slide-8
SLIDE 8

Rio Grande Valley Freight and Trade Transportation Plan June 4, 2020

8

  • Did the designation process miss anything?

Multimodal Freight Network Review

  • Does this analysis match your expectations?

Commodity Flow Forecasts

  • What areas of performance are most important to address?
  • What multimodal challenges are a barrier to freight movement?

Infrastructure and Performance

  • Are we missing important industries or groups?
  • Are there specific companies or people we should reach?

Stakeholder Engagement Update

Objectives of this Meeting

slide-9
SLIDE 9

Rio Grande Valley Freight and Trade Transportation Plan June 4, 2020

Regional Multimodal Freight Network

slide-10
SLIDE 10

Rio Grande Valley Freight and Trade Transportation Plan June 4, 2020

Considerations for Network Designation

▪ Include all freight modes: – Highway, rail, port, waterway, airport, and pipeline ▪ Start with a data-driven approach to highway designation: – 30% goods movement – 25% market access – 25% economic preparedness – 20% supply chain support ▪ Refine with stakeholder input: – Specific locations – Types of locations

Highway Designation:

  • Current trucks, tonnage, and value
  • Future trucks, tonnage, and value
  • Oversize/overweight corridors
  • Employment in freight industries
  • Freight business locations
  • Population growth
  • Travel time to ports-of-entry
  • Travel time to intermodal facilities
  • Proximity to Foreign Trade Zones
  • Stakeholder input
slide-11
SLIDE 11

Rio Grande Valley Freight and Trade Transportation Plan June 4, 2020

Draft Regional Multimodal Freight Network: Highway

11

▪ Three highway tiers: – Major freight highways – Regional connectors – Local connectors ▪ Truck POEs – Including Donna and Anzalduas

slide-12
SLIDE 12

Rio Grande Valley Freight and Trade Transportation Plan June 4, 2020

Draft Regional Multimodal Freight Network: Non-Highway

12

▪ All freight railroads ▪ Rail POE ▪ Maritime ports ▪ Waterways ▪ Cargo airports ▪ Pipelines

slide-13
SLIDE 13

Rio Grande Valley Freight and Trade Transportation Plan June 4, 2020

How to View and Comment on the Network

13

  • 1. Zoom or search to find a location

as you would on Google Maps

  • 2. Click the type of comment you

want to leave

  • 3. Click on the map wherever you

would like to leave a comment

  • 4. Add an optional text comment

with the facility name or other note

  • 5. Click “Close”

Comments save automatically

slide-14
SLIDE 14

Rio Grande Valley Freight and Trade Transportation Plan June 4, 2020

How to View and Comment on the Network: More Tips

14

▪ Panels can be re-opened using the circled buttons ▪ Additional information can be turned on or off using the Layers panel ▪ More detail is visible as you zoom

slide-15
SLIDE 15

Rio Grande Valley Freight and Trade Transportation Plan June 4, 2020

Commodity Flows and Forecasts

slide-16
SLIDE 16

Rio Grande Valley Freight and Trade Transportation Plan June 4, 2020

Commodity Flows and Forecasts ▪ Base year: 2018 ▪ Forecast year: 2050 ▪ Data sources: – Transearch: Basis of analysis for highway, waterway, and air – STB Waybill: Rail flows – Enverus drilling data for the Permian Basin: enhancement to Transearch – TTI border crossing statistics: enhancement to Transearch ▪ Ton

  • nna

nage e an and v d val alue ue ma may y no not be t be di dire rectl ctly co compar arab able le ac across

  • ss mo

modes des due due to

  • di

different erent da data ta so sour urce ces. s.

16

slide-17
SLIDE 17

Rio Grande Valley Freight and Trade Transportation Plan June 4, 2020

Base Year: All Modes

17

Tonnage: 46.0M Value: $46.1B

Within Study Area, 30% Domestic Outbound, 25% Foreign Outbound, 7% Domestic Inbound, 21% Foreign Inbound, 17%

2018 Tons by Direction

slide-18
SLIDE 18

Rio Grande Valley Freight and Trade Transportation Plan June 4, 2020

All Modes: Inbound Freight

18

▪ Other Texas: 36% of inbound traffic ▪ Mexican origins: 44% of inbound traffic ▪ Nonmetallic minerals/Petroleum and coal products: 48% of inbound traffic

slide-19
SLIDE 19

Rio Grande Valley Freight and Trade Transportation Plan June 4, 2020

All Modes: Outbound Freight

19

▪ Other Texas: 49% of outbound traffic ▪ Mexican destinations: 20% of outbound traffic ▪ California: 8% of outbound traffic ▪ Outbound commodities more evenly distributed than inbound

slide-20
SLIDE 20

Rio Grande Valley Freight and Trade Transportation Plan June 4, 2020

Base Year: Truck

20

Tonnage: 35.6M Value: $35.4B

Outbound Trading Partners Inbound Trading Partners

Within Study Area, 38% Domestic Outbound, 29% Foreign Outbound, 7% Domestic Inbound, 16% Foreign Inbound, 10%

2018 Tons by Direction

slide-21
SLIDE 21

Rio Grande Valley Freight and Trade Transportation Plan June 4, 2020

Top Commodities: Truck

21

slide-22
SLIDE 22

Rio Grande Valley Freight and Trade Transportation Plan June 4, 2020

Base Year: Passthrough Traffic - Truck

22

Tonnage: 18.1M Value: $38.1B

Final Termination States Initial Origin States

Export, 33% Import, 67% Domestic, 0%

2018 Tons by Direction

slide-23
SLIDE 23

Rio Grande Valley Freight and Trade Transportation Plan June 4, 2020

Top Commodities: Passthrough Traffic - Truck

23

slide-24
SLIDE 24

Rio Grande Valley Freight and Trade Transportation Plan June 4, 2020

Base Year: Passthrough Traffic - Rail

24

Tonnage: 67k Value: Not available

Passthrough - Termination States Passthrough - Origin States

Domestic, 6% Export, 74% Import, 20%

2018 Tons by Direction

slide-25
SLIDE 25

Rio Grande Valley Freight and Trade Transportation Plan June 4, 2020

Base Year: Rail

25

Tonnage: 2.1M Value: $2.6B

Outbound Trading Partners Inbound Trading Partners

Within Study Area, 1% Domestic Outbound, 25% Foreign Outbound, 2% Domestic Inbound, 68% Foreign Inbound, 4%

2018 Tons by Direction

slide-26
SLIDE 26

Rio Grande Valley Freight and Trade Transportation Plan June 4, 2020

Top Commodities: Rail

26

slide-27
SLIDE 27

Rio Grande Valley Freight and Trade Transportation Plan June 4, 2020

Base Year: Water

27

Tonnage: 8.3M Value: $2.8B

Outbound Trading Partners Inbound Trading Partners

Within Study Area, 1% Domestic Outbound, 6% Foreign Outbound, 13% Domestic Inbound, 30% Foreign Inbound, 50%

2018 Tons by Direction

slide-28
SLIDE 28

Rio Grande Valley Freight and Trade Transportation Plan June 4, 2020

Top Commodities: Water

28

slide-29
SLIDE 29

Rio Grande Valley Freight and Trade Transportation Plan June 4, 2020

Base Year: Air

29

Tonnage: 0.04M Value: $5.1B

Outbound Trading Partners Inbound Trading Partners

Domestic Outbound, 43% Domestic Inbound, 57%

2018 Tons by Direction

slide-30
SLIDE 30

Rio Grande Valley Freight and Trade Transportation Plan June 4, 2020

Top Commodities: Air

30

slide-31
SLIDE 31

Rio Grande Valley Freight and Trade Transportation Plan June 4, 2020

Forecast Year (2050) Summary: All Modes ▪ RGV tonnage growth is slightly lower than statewide, but similar ▪ RGV value growth is slightly higher than statewide, but similar

31

RGV 2018 RGV 2050 RGV % Change Texas % Change Tonnage 46.0M 79.4M 73% 77% Value $46.1B $112.5B 144% 136%

slide-32
SLIDE 32

Rio Grande Valley Freight and Trade Transportation Plan June 4, 2020

Direction: All Modes ▪ Truck: largest share at 84% of tons ▪ Water and rail: most inbound at 38% and 9%, respectively ▪ Water and rail: drop to 25 and 6% of inbound, respectively in 2050

32

slide-33
SLIDE 33

Rio Grande Valley Freight and Trade Transportation Plan June 4, 2020

Commodity Growth: All Modes ▪ Most growth 2018-2050: – Waste or Scrap Materials – Secondary Traffic – Nonmetallic

33

slide-34
SLIDE 34

Rio Grande Valley Freight and Trade Transportation Plan June 4, 2020

Forecast: Truck ▪ +81% Tonnage

– Total Tons (2018) – 64.5M – Total Tons (2050) – 35.6M

▪ +133% Value

– Total Value (2018) – $35.4B – Total Value (2050) – $82.5B

▪ Waste or scrap, secondary traffic and clay, concrete, glass and stone are expected to increase the most on a percentage basis

34

slide-35
SLIDE 35

Rio Grande Valley Freight and Trade Transportation Plan June 4, 2020

Forecast: Rail

▪ +71% Tonnage

– Total Tons (2018) – 2.1M – Total Tons (2050) – 3.6M

▪ Miscellaneous organic and inorganic materials contribute the most to increase in chemical products ▪ Liquors, blended extracts and sugar products are responsible for growth in food and kindred products

35

slide-36
SLIDE 36

Rio Grande Valley Freight and Trade Transportation Plan June 4, 2020

Forecast: Water ▪ +36% Tonnage

– Total Tons (2018) – 8.3M – Total Tons (2050) – 11.3M

▪ +96% Value

– Total Value (2018) – $2.8B – Total Value (2050) – $5.5B

▪ Commodities with most growth: – Nonmetallic minerals – Petroleum or coal products

36

slide-37
SLIDE 37

Rio Grande Valley Freight and Trade Transportation Plan June 4, 2020

Forecast: Air ▪ +142% Tonnage

– Total Tons (2018) – 0.04M – Total Tons (2050) – 0.1M

▪ +156% Value

– Total Value (2018) – $5.1B – Total Value (2050) – $13.1B

▪ Commodities with most growth or new top commodities: – Chemi emica cals ls or

  • r al

allie ied d prod

  • duc

ucts ts – Transportation equipment

37

slide-38
SLIDE 38

Rio Grande Valley Freight and Trade Transportation Plan June 4, 2020

Growth in Key Commodities

38

Total Growth: 73% Oil/Gas Growth: 43% Produce Growth: 87% Secondary/Drayage Growth: 136%

slide-39
SLIDE 39

Rio Grande Valley Freight and Trade Transportation Plan June 4, 2020

Infrastructure and Performance

39

Mobility (Congestion and Reliability) Asset Management (Pavement and Bridge) Truck Parking Non-Highway Issues

slide-40
SLIDE 40

Rio Grande Valley Freight and Trade Transportation Plan June 4, 2020

Mobility: Congestion (PM Peak)

40

▪ Based on the TxDOT Statewide Analysis Model (SAM) ▪ Most congested locations are in cities, and congestion is lower north of Edinburg/Harlingen

slide-41
SLIDE 41

Rio Grande Valley Freight and Trade Transportation Plan June 4, 2020

Mobility: Reliability (PM Peak)

41

▪ Based on historical data (2018-2019) ▪ Some important regional connections are unreliable: – US 281/Military Highway – I-169/SH 550 – SH 48

slide-42
SLIDE 42

Rio Grande Valley Freight and Trade Transportation Plan June 4, 2020

Safety: Truck-Involved Crashes (2015-2019)

42

▪ 3,788 truck-involved crashes in 5-year period ▪ 32 fatal crashes – 16 on IH/US highway – 16 on other routes ▪ 944 injury crashes ▪ 2812 other crashes

Note: “truck-involved” determined by CMV Vehicle Type field

slide-43
SLIDE 43

Rio Grande Valley Freight and Trade Transportation Plan June 4, 2020

Asset Management: Pavement

43

▪ Major roadways have good pavement quality, but this is less likely for local connections. – IH/US: 84% good, 1% poor – SH: 58% good, 8% poor – Others: 39% good, 21% poor

slide-44
SLIDE 44

Rio Grande Valley Freight and Trade Transportation Plan June 4, 2020

Asset Management: Bridge Conditions

44

▪ No posted and poor condition bridges cross another roadway ▪ None carry major roadways, but some are local connectors – Ex: Minnesota Ave. in Brownsville

slide-45
SLIDE 45

Rio Grande Valley Freight and Trade Transportation Plan June 4, 2020

Asset Management: Bridge Vertical Clearance

45

▪ Most bridges are south

  • f SH 186

▪ Few bridges off of major corridors cross another roadway ▪ Where bridges are lower than 16.5 feet, the crossed facility is typically a minor roadway – 11 over IH/US – 16 over SH/SS

slide-46
SLIDE 46

Rio Grande Valley Freight and Trade Transportation Plan June 4, 2020

Truck Parking: Authorized and Unauthorized

46

slide-47
SLIDE 47

Rio Grande Valley Freight and Trade Transportation Plan June 4, 2020

Stakeholder Engagement Update

slide-48
SLIDE 48

Rio Grande Valley Freight and Trade Transportation Plan June 4, 2020

Stakeholder Engagement Activities To-Date

Steering Committee (2)

  • Define goals and
  • bjectives
  • Identify critical

needs

  • Refine network

designation process

Transportation Forums (4 of 8)

  • Explore needs

and challenges

  • Identify specific

locations for needs and network designation

Interviews (14 of 30)

  • Understand
  • perating

conditions and requirements

  • Identify supply

chains and economic linkages

slide-49
SLIDE 49

Rio Grande Valley Freight and Trade Transportation Plan June 4, 2020

Stakeholder Engagement Activities: Interviews

Complete Targets

Public ▪ RGV MPO ▪ RGV Partnership ▪ Port of Brownsville ▪ Pharr International Bridge ▪ Progreso International Bridge Private ▪ Texas International Produce Association ▪ South Texas Manufacturers Association ▪ TransMontaigne Partners ▪ Gulf Stream Marine ▪ Lone Star Citrus ▪ Bettcher Manufacturing ▪ NIBCO ▪ Regal Beloit ▪ Rio Valley Switching Public ▪ Port of Harlingen ▪ Cargo Airport(s) ▪ Economic Development Corporations Private ▪ Texas Warehouse Association ▪ Customs Brokers Associations ▪ Trucking Companies (including OS/OW) ▪ Owner-Operator Independent Drivers Association ▪ Railroads ▪ Barge Company ▪ Industrial Developer ▪ Cold Storage ▪ Warehousing ▪ Advanced Manufacturing (automotive, electronics) ▪ Non-Produce Agriculture

slide-50
SLIDE 50

Rio Grande Valley Freight and Trade Transportation Plan June 4, 2020

Key Findings from Stakeholder Engagement

50

  • Highways that move the most freight (trucks, tonnage) are the

highest priority.

  • First and last mile connections to maritime and border ports are

critical. Network Designation

  • Pipeline shutdowns in Mexico have led to immense truck traffic

between the Port of Brownsville and Mexico.

  • The binational economy is strongly linked; goods and people are

moving back and forth (not just through). Supply Chains and Economic Links

slide-51
SLIDE 51

Rio Grande Valley Freight and Trade Transportation Plan June 4, 2020

Key Findings from Stakeholder Engagement

51

  • Connectivity is a top concern.
  • Additional connections between the I-69 corridors, especially north
  • f SH 186
  • Accessing major highways
  • Congestion and reliability are made worse by lack of alternatives

for freight.

  • Interchanges and intersections
  • Signals on local thoroughfares
  • Border crossings, customs, and inspections are closely tied to the
  • verall performance of the system.
  • Wait times, operating hours

Needs and Challenges

slide-52
SLIDE 52

Rio Grande Valley Freight and Trade Transportation Plan June 4, 2020

Closing and Next Steps

52

slide-53
SLIDE 53

Rio Grande Valley Freight and Trade Transportation Plan June 4, 2020

Project Milestones and Timeline

53

Milestones Schedule

Regional freight profile, land use analysis, needs assessment, and performance measures Spring 2020 – Summer 2020 Regional freight recommendations, strategies, and implementation plan Summer 2020 – Fall 2020 Regional Freight Plan and Executive Summary Late 2020

Steering Committee Meetings August 2020 November 2020 Round 2 Transportation Forums August 2020

slide-54
SLIDE 54

Rio Grande Valley Freight and Trade Transportation Plan June 4, 2020

Contact Information

54

Casey Wells TX Dept. of Transportation Casey.Wells@txdot.gov (512) 423-8986 Paula Dowell, Ph.D. Cambridge Systematics PDowell@CamSys.com (404) 861-5834 Lizzie Welch, P.E. Cambridge Systematics EWelch@CamSys.com (512) 691-8534