SLIDE 6 9 6 9 1 0 4 3 1 4 6 2 1 5 3 0 2 0 6 0 2 0 4 4 2 1 0 0 2 2 1 1 1 6 6 6 1 3 7 0 1 1 5 0 9 5 0 8 3 2 1112 1124 1031 1204 898 697 753 716 708 645 694 728 728 804 940 838 753 778 645 658 579 574 530 376 290 265 6 3 1 5 4 0 4 5 8 4 0 3 5 6 8 4 9 5 4 3 9 3 8 2 3 0 7 2 1 1 2 1 1 2 2 6 2 5 1 123 132 149 182 258 269 265 279 258 241 210 184 219 1 0 2 1 0 7 8 1 1 0 6 1 5 4 1 5 4 2 5 7 2 7 2 2 0 7 2 0 3 2 0 8 2 0 2 2 1 2 1 8 3 2 2 0 2 7 0 3 2 4 2 8 0 4 2 5 4 1 9 3 5 0 2 3 6 2 1 8 2 0 4 1 6 9 2 9 1 2 6 4 3 2 0 1 3 8 1 0 0 1 4 8 1 2 9 1 5 9 1 5 6 1 4 5 2 6 6 1 9 2 1 1 9 1 1 9 1 1 6 1 4 3 1 5 8 188 95 97 150 230 304 268 233 115
34
4 4 7 9 4 7 9 8 5 0 6 9 5 2 2 8 6 1 0 0 5 4 2 6 5 4 0 0 5 4 4 9 4 7 3 3 4 1 1 4 3 6 7 5 3 6 0 4 3 4 8 0 1000 2000 3000 4000 5000 6000 7000 2 0 0 4 2 0 0 5 2 0 0 6 2 0 0 7 2 0 0 8 2 0 0 9 2 0 1 0 2 0 1 1 2 0 1 2 2 0 1 3 2 0 1 4 2 0 1 5 2 0 1 6
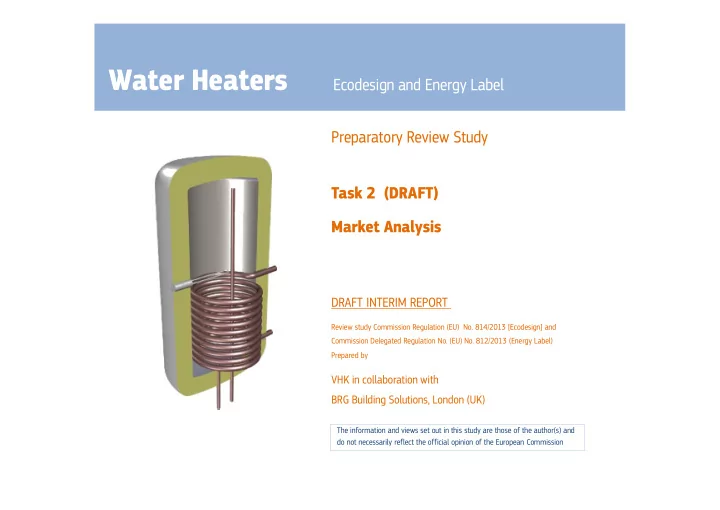
EU2 8 Non-Electric W H Production 2 0 0 4 / 2 0 1 6
(in´ 000 units); source: Eurostat
United Kingdom Sweden Slovenia Slovakia Romania Netherlands Malta Luxemburg Lituania Latvia I reland Hungary Finland Estonia Czech Republic Cyprus Croatia Bulgaria Belgium Denm ark I taly Austria Greece Poland France Spain Portugal Germ any _
Non electric WH production EU 2016: 3.48 m units @ €1.12bn (in manufacturer selling prices msp) . Average msp= €333/unit
2004: 4.5 m @ €1.5bn *
*=nominal 1.3bn eur, inflation corrected to 2016