
SLIDE 1
6/27/2013 1
Waiting in Line to Vote
Charles Stewart III MIT For the Presidential Commission on Election Administration June 28, 2013
- Lines are costly
- Lines are not universal
- Queuing theory helps organize thinking about
improvements
- Research on effective strategies is thin
Long lines discourage voting
- Voting and Registration Supplement (VRS) of the
Current Population Survey
– 500k eligible voters failed to vote because of inconvenient hours or polling place locations, or lines too long
- Cooperative Congressional Election Study (CCES)
– 730k non‐voters due to long lines at the polls
- Survey of the Performance of American Elections
(SPAE)
– 740k non‐voters cite lines as a major factor
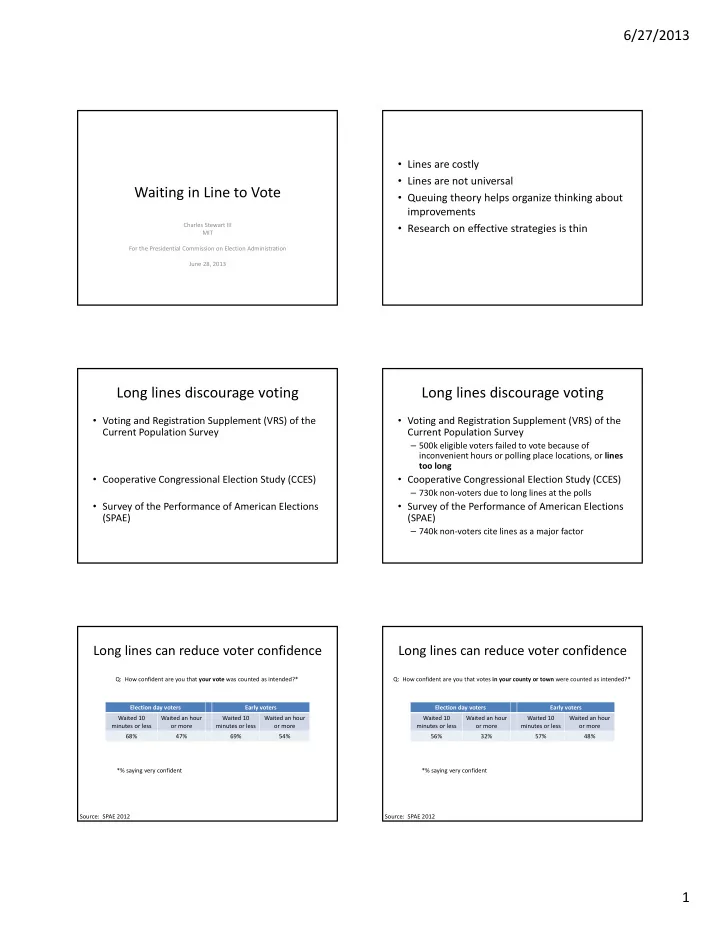
Long lines can reduce voter confidence
Election day voters Early voters Waited 10 minutes or less Waited an hour
- r more
Waited 10 minutes or less Waited an hour
- r more
68% 47% 69% 54% Q: How confident are you that your vote was counted as intended?* *% saying very confident Source: SPAE 2012
Long lines can reduce voter confidence
Election day voters Early voters Waited 10 minutes or less Waited an hour
- r more
Waited 10 minutes or less Waited an hour
- r more
56% 32% 57% 48% Q: How confident are you that votes in your county or town were counted as intended?* *% saying very confident Source: SPAE 2012