
SLIDE 1
2019/5/12 1
Managing Waiting Lines
- The Economies of Waiting
- Features of Queuing Systems
- Estimating Waiting Times
- Waiting Line Management
Shin‐Ming Guo NKFUST
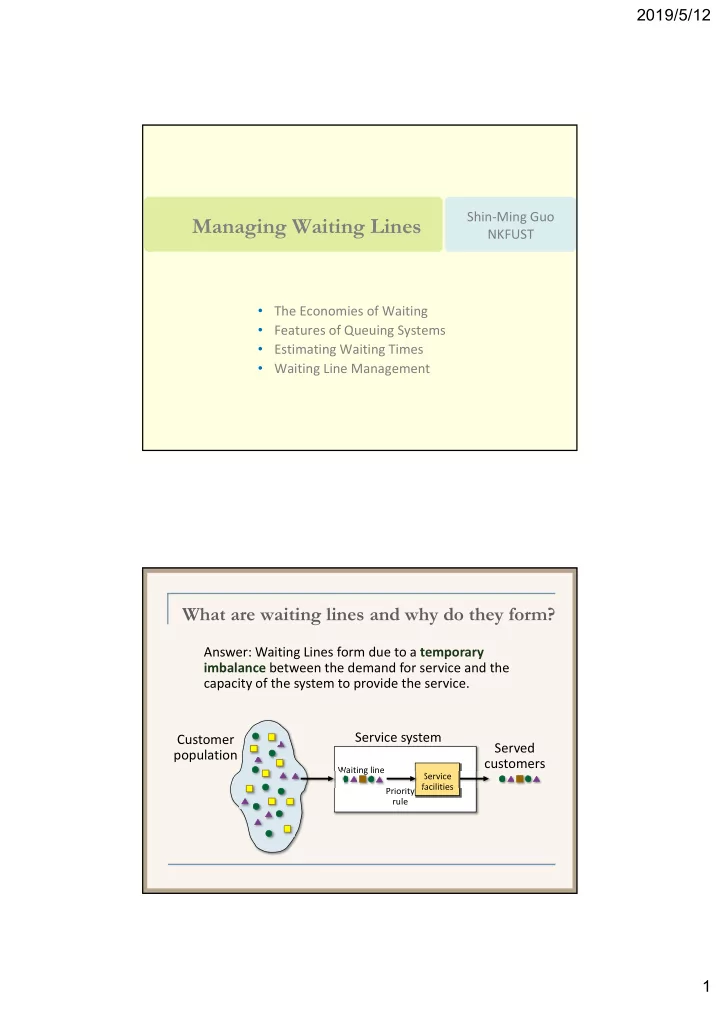
What are waiting lines and why do they form?
Answer: Waiting Lines form due to a temporary imbalance between the demand for service and the capacity of the system to provide the service. Customer population Service system
Waiting line Priority rule Service facilities