SLIDE 48 EMPLOYEE COMPENSATION
County of Fairfax, VA – Lines of Business Presentation
48
Uniformed Retirement System
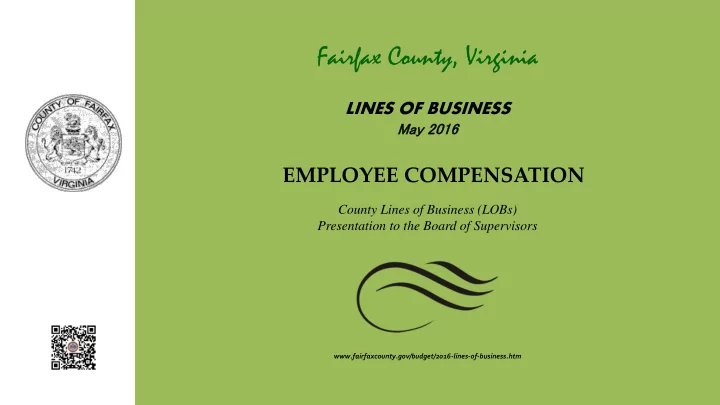
Retirement Benefit Example
$130,611 $132,571 $134,559 $99,007 $100,492 $101,999 $103,529 $105,082 $106,659 $108,259 $109,882 $111,531 $113,204 $114,902 $116,625 $11,881 $11,881 $11,881 $11,881 $11,881 $11,881 $11,881 $11,881 $11,881 $39,774 $40,172 $40,573
$0 $10,000 $20,000 $30,000 $40,000 $50,000 $60,000 $70,000 $80,000 $90,000 $100,000 $110,000 $120,000 $130,000 $140,000 $150,000 $160,000
2043 - Age 55 2044 - Age 56 2045 - Age 57 2046 - Age 58 2047 - Age 59 2048 - Age 60 2049 - Age 61 2050 - Age 62 2051 - Age 63 2052 - Age 64 2053 - Age 65 2054 - Age 66 2055 - Age 67 2056 - Age 68 2057 - Age 69
Annual Salary/Benefit
Projected Retirement Benefit Based on Average New Hire
Salary Base Retirement Benefit Pre-SS Supplement Social Security Final Average Salary
Based on average FY 2016 F-Scale new hire as of March 2016. Does not include pension-eligible stipends or extra pay. Assumes 1.5% Market Rate Adjustments and full funding of pay plan each year. Assumes employee works two years after reaching eligibility for full retirement and retiree health benefits. Estimates Social Security benefit at 30% of Final Average Salary. Assumes 1.5% annual County COLA and 1.00% annual COLA for Social Security.
- New Hire in 2016 at Age 28, Hired at Step 1
- Assume F-18 with no promotions
- Retiring at age 58 in 2046 with 29 Years of Service
Initial Income Replacement Ratios (as % of Final Average Salary) Base Retirement Benefit – 75% Pre-SS Supplement – 9% TOTAL – 84%