
SLIDE 1
Rectangles
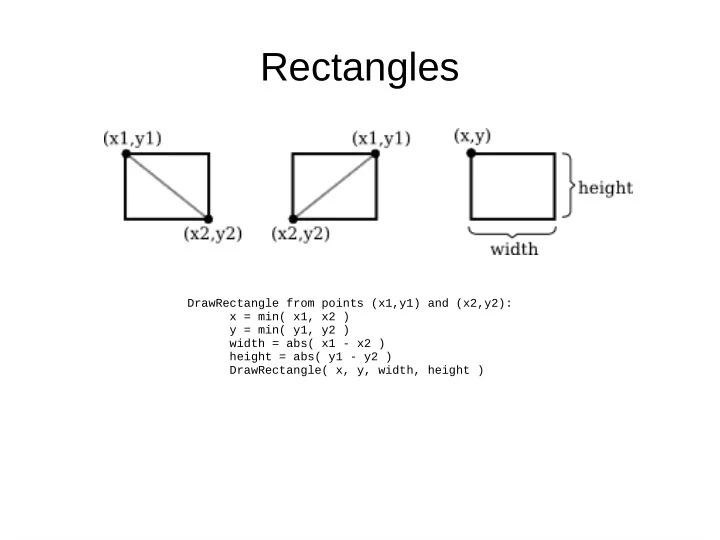
DrawRectangle from points (x1,y1) and (x2,y2): x = min( x1, x2 ) y = min( y1, y2 ) width = abs( x1 - x2 ) height = abs( y1 - y2 ) DrawRectangle( x, y, width, height )
Rectangles DrawRectangle from points (x1,y1) and (x2,y2): x = min( - - PowerPoint PPT Presentation
Rectangles DrawRectangle from points (x1,y1) and (x2,y2): x = min( x1, x2 ) y = min( y1, y2 ) width = abs( x1 - x2 ) height = abs( y1 - y2 ) DrawRectangle( x, y, width, height ) Ellipses Mathematically, the points on the oval are given by (
DrawRectangle from points (x1,y1) and (x2,y2): x = min( x1, x2 ) y = min( y1, y2 ) width = abs( x1 - x2 ) height = abs( y1 - y2 ) DrawRectangle( x, y, width, height )
Draw Oval with center (x,y), horizontal radius r1, and vertical radius r2: for i = 0 to numberOfLines: angle1 = i * (2*pi/numberOfLines) angle2 = (i+1) * (2*pi/numberOfLines) a1 = x + r1*cos(angle1) b1 = y + r2*sin(angle1) a2 = x + r1*cos(angle2) b2 = y + r2*sin(angle2) Draw Line from (x1,y1) to (x2,y2)
– Stroking it: like dragging a pen along the line – Filling it: means coloring all the points that are
– In a typical application, we have a rectangle made of
– We also have a set of geometric objects that are defined
T(x,y) = ( 800*(x+4)/8, 600*(3-y)/6 )
– Translation (moving objects) – Scale (changing the size of objects) – Rotation (turning objects) – Shear (tilting objects)
– x1 = x + e – y1 = y + f
A horizontal shear: x1 = x + b * y y1 = y for some constant shearing factor b. Similarly, a vertical shear with shearing factor c is given by the equations x1 = x y1 = c * x + y