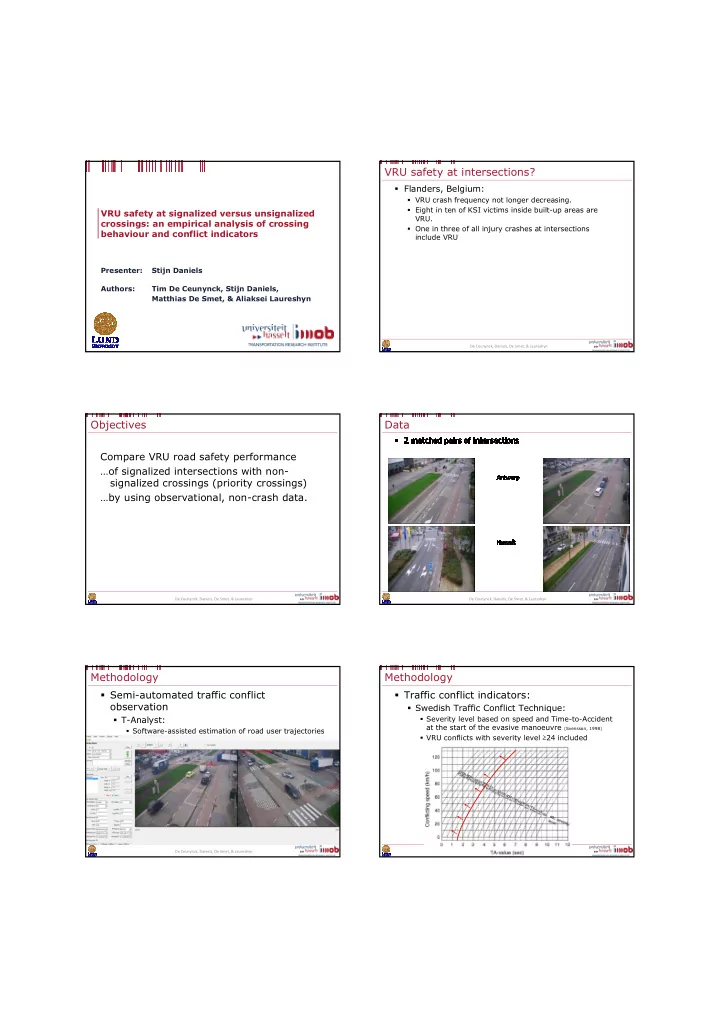

VRU safety at intersections? � Flanders, Belgium: � VRU crash frequency not longer decreasing. � Eight in ten of KSI victims inside built-up areas are VRU safety at signalized versus unsignalized VRU. crossings: an empirical analysis of crossing � One in three of all injury crashes at intersections behaviour and conflict indicators include VRU Presenter: Stijn Daniels Authors: Tim De Ceunynck, Stijn Daniels, Matthias De Smet, & Aliaksei Laureshyn De Ceunynck, Daniels, De Smet, & Laureshyn Objectives Data Compare VRU road safety performance …of signalized intersections with non- signalized crossings (priority crossings) …by using observational, non-crash data. De Ceunynck, Daniels, De Smet, & Laureshyn De Ceunynck, Daniels, De Smet, & Laureshyn Methodology Methodology � Semi-automated traffic conflict � Traffic conflict indicators: observation � Swedish Traffic Conflict Technique: � T-Analyst: � Severity level based on speed and Time-to-Accident at the start of the evasive manoeuvre (Svensson, 1998) � Software-assisted estimation of road user trajectories � VRU conflicts with severity level ≥ 24 included � Calculation of traffic conflict indicators De Ceunynck, Daniels, De Smet, & Laureshyn
Methodology Results – conflict observation � Supplementary systematic behavioural observations of VRU-MV interactions Antwerp Hasselt � 3h of video analysed per intersection unsignalized signalized unsignalized signalized � Data collected about Total # serious conflicts 33 22 114 9 � Gender + age VRU 1055 1536 775 743 Average � Looking behaviour VRU Hourly MV Minimum 36 60 24 12 volume � Interaction process (e.g. approaching behaviour, who Maximum 2484 3384 1596 1596 goes first) Average 37 127 225 350 Hourly 0 0 0 0 VRU Minimum volume Maximum 124 444 1052 1904 De Ceunynck, Daniels, De Smet, & Laureshyn De Ceunynck, Daniels, De Smet, & Laureshyn Results – conflict observation Results – conflict observation Correlation traffic volumes/h – #traffic conflicts/h � Conflict patterns at unsignalized intersections Location(s) Volume Simple linear R² regression Antwerp Hasselt Unsignalized intersections # MV #confl = 0.0010MV 0.137 (both) # VRU #confl = 0.0067VRU 0.509 Unsignalized intersection # MV #confl = 0.0022MV 0.360 Hasselt # VRU #confl = 0.0065VRU 0.480 Unsignalized intersection # MV #confl = 0.0005MV 0.353 Antwerp # VRU #confl = 0.0124MV 0.343 Signalized intersections # MV #confl = 0.0002MV 0.188 (both) # VRU #confl = 0.0006VRU 0.029 Signalized intersection # MV #confl = 0.0002MV 0.064 Hasselt # VRU #confl = 0.0004VRU 0.118 MV VRU MV VRU Signalized intersection # MV #confl = 0.0002MV 0.249 Antwerp # VRU #confl = 0.0022VRU 0.193 De Ceunynck, Daniels, De Smet, & Laureshyn Results – conflict observation Results – conflict observation Example of conflict with VRU coming from the far side of the road De Ceunynck, Daniels, De Smet, & Laureshyn De Ceunynck, Daniels, De Smet, & Laureshyn
Results – conflict observation Results – behavioural observations � Conflict patterns at signalized intersections Antwerp Hasselt MV VRU MV VRU De Ceunynck, Daniels, De Smet, & Laureshyn Results – behavioural observations Results – behavioural observation VRU looking behaviour unsignalized intersections De Ceunynck, Daniels, De Smet, & Laureshyn Results – behavioural observation Summary � Frequency of conflicts with VRU higher at unsignalized intersections VRU looking behaviour signalized intersections Contributing factor: sight obstruction due to vehicle on other � lane Correlation between (VRU) traffic volumes and hourly number � of conflicts at unsignalized intersections Conflicts with cyclists in counterflow at side road of � unsignalized intersections ‘Inherent’ conflicts at signalized intersections: VRU do not � always look, while MV do not always yield De Ceunynck, Daniels, De Smet, & Laureshyn De Ceunynck, Daniels, De Smet, & Laureshyn
Further research Extend data � But how much? � Check additional conflict indicators for safety critical events � � Compare with crash data De Ceunynck, Daniels, De Smet, & Laureshyn De Ceunynck, Daniels, De Smet, & Laureshyn
Recommend
More recommend