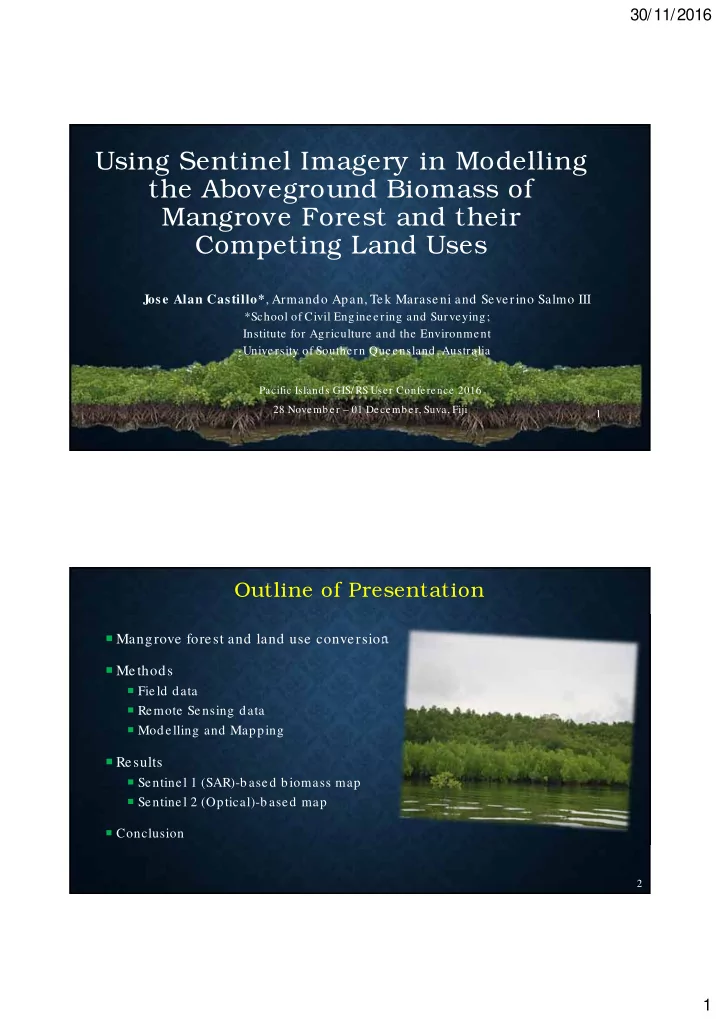

30/11/2016 Using Sentinel Imagery in Modelling the Aboveground Biomass of Mangrove Forest and their Competing Land Uses Jose Alan Castillo* , Armando Apan, Tek Maraseni and Severino Salmo III *School of Civil Engineering and Surveying; Institute for Agriculture and the Environment University of Southern Queensland, Australia Pacific Islands GIS/ RS User Conference 2016 28 November – 01 December, Suva, Fiji 1 Outline of Presentation � Mangrove forest and land use conversion � Methods � Field data � Remote Sensing data � Modelling and Mapping � Results � Sentinel 1 (SAR)-based biomass map � Sentinel 2 (Optical)-based map � Conclusion 2 1
30/11/2016 Mangroves � “Forest of the sea”, interface of land and sea � Provide many ecosystem services including huge Carbon reservoir Source: ITTO Tropical Forest Update (2012) 3 � Potentially large C emissions from biomass and soil due to mangrove conversion � Mapping and monitoring of biomass is important � Sentinel imagery is new and free of charge but not yet fully evaluated in mangrove biomass modelling and mapping 4 2
30/11/2016 Method � Honda Bay � West Pacific � Tropical climate � 1,527 mm rainfall 5 Method Coastal land uses/ land cover studied: � Mangrove Forests � Non-forest land uses in mangrove soil: � Aquaculture pond (abandoned) � Coconut plantation � Salt pond (abandoned) � Cleared mangrove 6 3
30/11/2016 Method: Field Data � Plots (7-m radius) to collect field data (species, DBH, etc) � 90 plots total (51- mangrove) � Plot coordinates – GPS � Published allometric models for mangrove biomass 7 Method: Remote Sensing data � Sentinel 1 (SAR) and Sentinel 2 (Multispectral) � SNAP (Sentinels Application Platform) software (Open Source) � Sentinel 1 (IW-GRD product): 3 dates � Sentinel 2 (L1C product): processed to L2A (BOA reflectance) using Sen2Cor plug-in � SRTM 30-m DEM 8 4
30/11/2016 Sentinel 1 IW-GRD High Resolution: 10m Sentinel 2 Spectral Band Resolutions (m) 9 Sentinel 1 SAR Image (VH Polarisation) 10 5
30/11/2016 Sentinel 2 (MS) False Color Infrared HSV 11 Method: Biomass Modelling and Mapping � Modelling the linear relationships done in Weka machine learning software � Model building: 75% of field plots; validation: 25% � Best biomass model (highest r, lowest RMSE) then used in ArcGIS to develop biomass maps � Prediction Map validation: 25% of plots + 10 plots more (i.e. 32 plots, 19 mangrove): - RMSE, %Prediction Accuracy 12 6
30/11/2016 WEKA MACHINE LEARNING SOFTWARE: OPEN SOURCE 13 Results Field data: Aboveground biomass were variable and highest in mangrove forest Land Use Mean aboveground Biom ass range biom ass (Mg ha -1 ) (Mg ha -1 ) Mangrove Forest 65.11 1.06 - 210.14 Non-mangrove Abandoned 0.04 0 - 0.40 aquaculture pond Coconut plantation 11.36 0.20 – 19.74 Salt pond 0 0 14 Cleared mangrove 0 0 7
30/11/2016 Results a Sentinel 1 VV and VH polarisations moderately correlate with biomass; adding elevation data greatly improved the prediction 100 90 80 71 65 64 56 60 52 50.5 49.4 46.3 45.7 45 43.7 43 40 28.1 20 0 VH_Oct VV_Oct VH_Dec VV_Dec VH_Jan VV_Jan VV_Oct + VH_Jan + elevation r (%) RMSE (Mg/ ha) 15 AGB = -37.702 + 4.3591*VV OCT - 3.2955*VH JAN + 12.6209*Elevation SENTINEL 1-BASED ABOVEGROUND BIOMASS MAP Honda Bay RMSE: 25.5 Mg/ ha Prediction Accuracy: 83.8 % 16 8
30/11/2016 Results A Sentinel 2 Red Edge 1 and Red Edge 2 bands combination provided better correlation and prediction; adding elevation data improved prediction 100 91.4 83.49 82.87 80 80 78 80 72 60 49.8 43.98 36.75 40 35.23 30.14 29.35 22.85 20 0 r (%) RMSE (Mg/ ha) 17 AGB = -3.2269 + 885.8416*Red – 1422.9515*Red Edge1 + 1320.47*Red Edge 2 – 751.8883*NIR + 9.9243*Elevation SENTINEL 2-BASED ABOVEGROUND BIOMASS SENTINEL 2-BASED ABOVEGROUND BIOMASS MAP MAP Honda Bay RMSE: 26.9 Mg/ ha Prediction Accuracy : 83.2 % 18 9
30/11/2016 Results A SENTINEL 2 NDI45 VEGETATION INDEX GAVE BETTER CORRELATION AND PREDICTION WITH BIOMASS 100 88.69 86.99 80.21 78 80 60 40 34.08 32.68 26.29 26.33 20 0 NDI45 NDVI IRECI TNDVI r (%) RMSE (Mg/ ha) NDI45 = Normalised Diff. Index 4 and 5 (Red Edge 1 – Red) / (Red Edge 1 + Red) IRECI = Inverted Red Edge Chlorophyll Index (Red Edge 3 - Red)/ (R. Edge 1- R. Edge 2) AGB = 150.0705*NDI45 SENTINEL 2 NDI45-BASED ABOVEGROUND BIOMASS MAP SENTINEL 2 NDI45-BASED ABOVEGROUND BIOMASS MAP Honda Bay RMSE: 27.9 Mg/ ha Prediction Accuracy: 82.2 % 20 10
30/11/2016 CONCLUSION � Sentinel 1 and 2 data, with SRTM elevation, useful in mapping aboveground biomass of mangrove in the coast of southern Honda Bay � Derived maps for pinpointing high biomass areas for policy and management attention 21 Conclusion � Where clouds are persistent, Sentinel 1 SAR imagery is a useful option to map coastal biomass as SAR are not weather-dependent � RS/ GIS users from developing countries would benefit from Sentinel imagery as they are high resolution (10-20m), available for free and with support user-friendly open source software (i.e. SNAP) 22 11
30/11/2016 23 12
Recommend
More recommend