
SLIDE 1
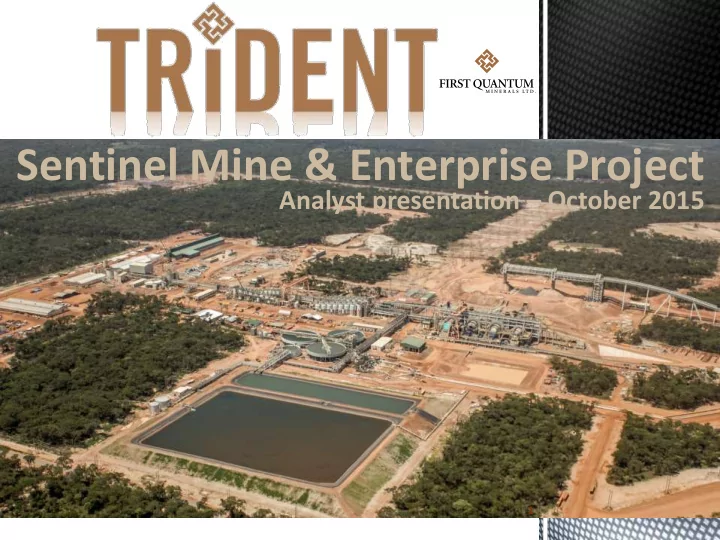
Analyst presentation – October 2015
Sentinel Mine & Enterprise Project
1
Sentinel Mine & Enterprise Project Analyst presentation October - - PowerPoint PPT Presentation
Sentinel Mine & Enterprise Project Analyst presentation October 2015 1 Trident Project location 2 Orientation project layout YOU ARE HERE 3 Sentinel Mine 4 Total Sentinel capex $2.1billion Total Sentinel capex = approx
1
2
3
YOU ARE HERE
4
Project scope:
Total Sentinel capex = approx $7,500/t
5 PROJECT ACQUISITION – FEBRUARY 2010 FIRST ROUGH CONCENTRATE – DECEMBER 2014
6
Resource statement published March 2012:
Operations:
7
Cost efficient production depends on high volume throughput
Status:
Milestones:
Production rampup:
8
1 2 3 4 5 200,000 400,000 600,000 800,000 1,000,000 1,200,000 1,400,000 1,600,000 Jun-12 Jun-13 Jun-14 Jun-15
Monthly manhours + Lost Time Incidents
9
37.8 million man-hours to date 11 total LTI’s to date
Total 2012 2013 2014 Jan-15 Feb-15 Mar-15 Apr-15 May-15 Jun-15 Jul-15 Aug-15 Manhours (million) 37.8 2.3 10.8 15.2 1.1 1.1 1.2 1.3 1.3 1.3 1.1 1.1 LTI Rate 0.058 0.087 0.061 0.049 0.048 0.046 0.057 0.055 0.064 0.062 0.060 0.058 Severity 4.09 5.04 1.51 1.03 0.99 0.96 4.76 4.58 4.51 4.34 4.21 4.09
SE Ramp NE Ramp Crusher 1a & 2a Crusher 3a Temp ramp Conveyor & Access Ramp Main Waste Ramp 5 Yr Pit Limit Current Mining Face
10
SE Ramp NE Ramp Crusher 1a & 2a Crusher 3a Temp ramp Conveyor & Access Ramp Main Waste Ramp 5 Yr Pit Limit Current Mining Face
11
SE Ramp NE Ramp Crusher 1a & 2a Crusher 3a Temp ramp Conveyor & Access Ramp Main Waste Ramp 5 Yr Pit Limit ‘15 Wet Weather Sumps
12
SE Ramp NE Ramp Crusher 1a & 2a Crusher 3a Temp ramp Conveyor & Access Ramp Main Waste Ramp 5 Yr Pit Limit SE Boxcut Sump
Mining Horizon as at End 2016
13
14 Mining – main fleet Units ThyssenKrupp 63-89 in pit crushers 3 Caterpillar MD6640 drills 7 CAT 7495HR rope shovels 3 Komatsu PC5500 face shovels 2 Komatsu PC5500 excavator 1 Komatsu 960E trucks (330 tonne) 15 Komatsu 860E trucks (250 tonne) 15 Komatsu HD1500 trucks (150 tonne) 10
2,000,000 3,000,000 4,000,000 5,000,000 6,000,000 7,000,000 Jan-15 Mar-15 May-15 Jul-15 Sep-15 Nov-15 Jan-16 Mar-16 May-16 Jul-16 Sep-16 Nov-16 BCMS Mined
Mining Production Volumes
Act Ore BCM Act Waste BCM Fcst Ore BCM Fcst Waste BCM
Consistency improvements and production rampup:
15
Consistency improvements and production rampup:
components + improved crushing.
1000 2000 3000 4000 5000 20000 40000 60000 80000 100000 1-Jan-15 14-Jan-15 27-Jan-15 9-Feb-15 22-Feb-15 7-Mar-15 20-Mar-15 2-Apr-15 15-Apr-15 28-Apr-15 11-May-15 24-May-15 6-Jun-15 19-Jun-15 2-Jul-15 15-Jul-15 28-Jul-15 10-Aug-15 23-Aug-15 5-Sep-15 18-Sep-15 tones / hour Tonnes
Crushing – Daily Volumes
Crushing dry t Crushing dry t/h 1000 2000 3000 4000 5000 20000 40000 60000 80000 100000 1-Jan-15 14-Jan-15 27-Jan-15 9-Feb-15 22-Feb-15 7-Mar-15 20-Mar-15 2-Apr-15 15-Apr-15 28-Apr-15 11-May-15 24-May-15 6-Jun-15 19-Jun-15 2-Jul-15 15-Jul-15 28-Jul-15 10-Aug-15 23-Aug-15 5-Sep-15 18-Sep-15 tones / hour Tonnes
Milling – Daily Volumes
Milling dry t Milling dry t/h
16
20 40 60 80 100 0.0 1.0 2.0 3.0
Cu Rec - OSS
20 40 60 80 100 0.0 1.0 2.0 3.0
Cu Rec - OCC
20 40 60 80 100 0.0 1.0 2.0 3.0
Cu Rec - Primary
Consistency improvements and production rampup:
Cu grade (%) Cu grade (%) Cu grade (%) 0.00 5.00 10.00 15.00 20.00 25.00 30.00 200 400 600 800 1000 1200 1400 1600 1800 1-Jan-15 14-Jan-15 27-Jan-15 9-Feb-15 22-Feb-15 7-Mar-15 20-Mar-15 2-Apr-15 15-Apr-15 28-Apr-15 11-May-15 24-May-15 6-Jun-15 19-Jun-15 2-Jul-15 15-Jul-15 28-Jul-15 10-Aug-15 23-Aug-15 5-Sep-15 18-Sep-15 tonnes / hour
Concentrate – Daily Volumes
Conc ton Conc grade Cu %
17
next 2 months.
STEADY-STATE WORKFORCE Total Operations staff currently onsite 1,247 In recruitment 541 Approved operations positions 1,788 Ongoing indirect and contractor personnel 1,276 TOTAL 3,064
1,247 184 408 827 1,667 1,365 CURRENT OPERATIONS FOUNDATION & TOWN FQMO (ROADS) OPERATIONS CONTRACTORS CONSTRUCTION PROJECT PROJECT CONTRACTORS Total currently onsite = 5,698
$100+ million targeted savings across KMP, KML and FQMO Strategic contract reviews:
Rapid sourcing:
Warehousing and logistics:
Bottom up cost savings:
floor. Consolidation of support services between sites:
18
19
Maiden resource published December 2012:
Operations:
20
Project go ahead for Enterprise is contingent on nickel price and concentrate export levy
21
support to ZESCO for augmenting supply
22 20 40 60 80 100 120 140 160 Oct-15 Nov-15 Dec-15 Jan-16 Feb-16 Mar-16
Average Power Requirement (MW)
23
Lumwana – Kalumbila – Mumbwa Contractor Kalpataru Distance (km) 68 + 394 Towers 164 + 872 Mumbwa – Lusaka West Contractor KEC Distance (km) 134 Towers 298 Substations Kansanshi, Lumwana, Kalumbila ABB Lusaka West, Mumbwa NCC
Current situation:
Kariba drawdown, if turbines run at full rate:
Management of supply + demand:
25
26
conjunction with the mine.
27
Potential to move off balance sheet – strong interest from pension funds
4-Bedroom House 3-Bedroom Housing Affordable Housing Layout 2-Bedroom House
28
Guesthouse Serviced Apartments Banking Services
Fuel Station
29
Kalumbila Industrial Park
30
Children’s Playground and Sports Facilities Town Clinic Supermarket and Market Area Frontier Affordable School
31
32
2015 : community needs assessment for ongoing Trident Foundation CSR projects
33
Healthcare Community Infrastructure Livelihoods Conservation Farming Wildlife Conservation Forest Conservation Education