
SLIDE 1
8/12/2020 1
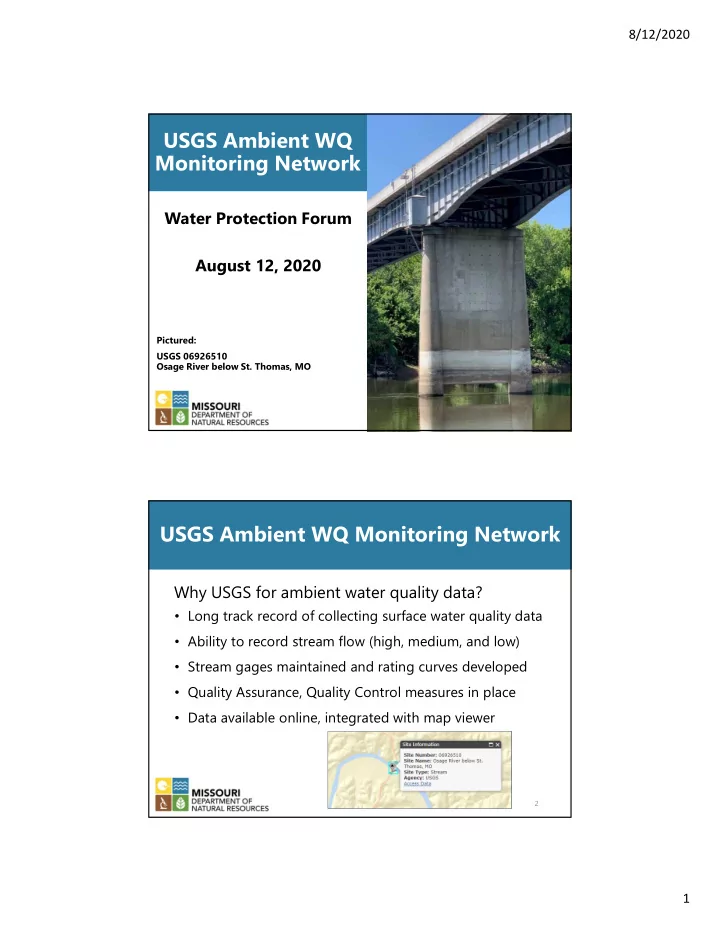
USGS Ambient WQ Monitoring Network
Water Protection Forum August 12, 2020
1
Pictured: USGS 06926510 Osage River below St. Thomas, MO
USGS Ambient WQ Monitoring Network
2
Why USGS for ambient water quality data?
- Long track record of collecting surface water quality data
- Ability to record stream flow (high, medium, and low)
- Stream gages maintained and rating curves developed
- Quality Assurance, Quality Control measures in place
- Data available online, integrated with map viewer