Monitoring Update: USGS Monitoring Efforts 2009 - 2014 In - - PowerPoint PPT Presentation

monitoring update usgs monitoring efforts 2009 2014
SMART_READER_LITE
LIVE PREVIEW

Monitoring Update: USGS Monitoring Efforts 2009 - 2014 In - - PowerPoint PPT Presentation

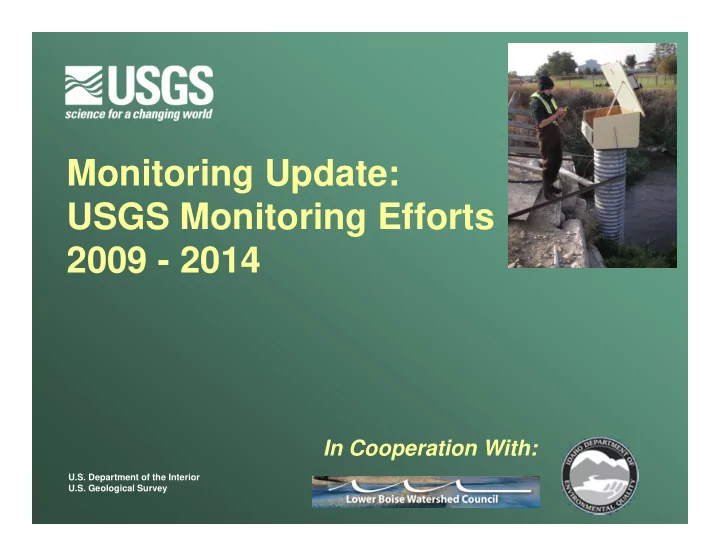
Monitoring Update: USGS Monitoring Efforts 2009 - 2014 In Cooperation With: U.S. Department of the Interior U.S. Geological Survey Outline Lower Boise Tributary monitoring 2009-2012 Fivemile and Tenmile Creeks WY2009 Indian Creek


slide-1
SLIDE 1

U.S. Department of the Interior U.S. Geological Survey

Monitoring Update: USGS Monitoring Efforts 2009 - 2014

In Cooperation With:

slide-2
SLIDE 2

Provisional Results

Outline

  • Lower Boise Tributary monitoring 2009-2012
  • Fivemile and Tenmile Creeks WY2009
  • Indian Creek WY2010
  • Mason Creek WY2011 – 2012
  • Dry Creek and Eagle Drain WY2012
  • Lower Boise River Monitoring – WY2013
  • Glenwood, Middleton, Parma
  • Surrogate data and Monitoring – WY2014
  • Boise River near Parma
slide-3
SLIDE 3

Provisional Results

Summary Tributary Work

Fivemile, Tenmile, Indian, and Mason Creeks

  • 3 event samples 5-6 sites in tributary watershed
  • Late April or Early May
  • July
  • November
  • Mason Creek
  • Streamgage
  • Water-quality monitor
  • Monthly samples
  • Regression models
  • Biology
slide-4
SLIDE 4

Provisional Results

Key Finding Spatial Loading

Fivemile and Tenmile Creeks

Fifteenmile Crk FM3 at Victory Rd TM1 at Franklin Rd FM1 at Franklin Rd TM2 at Eagle Rd FM2 at Eagle Rd

>90% TP, Sed, TN loads, every event

TM3 at Cloverdale Rd Meridian WWTP

slide-5
SLIDE 5

Provisional Results

Spatial Loading

Indian Creek

I3 at 21st St I4 at Sparrow Ave I2 at Simplot Blvd I5 at Broadmore Way

>60% TP, >40% TN loads, irrigation events

I6 at Robinson Rd Wilson Drain I1 at Mouth Riverside Canal Nampa WWTP

>35% Sed load, all events

slide-6
SLIDE 6

Provisional Results

Spatial Loading

Mason Creek

M2 at Wells Rd M3 at Ustick Rd M1 near Mouth M4 at Madison Ave

35% Sed, 44% TP load Irrigation events

M5 at Powerline Rd Highline Diversion

>60% TP, Sed loads, 55% TN load, July event

slide-7
SLIDE 7

Provisional Results

Instantaneous Loads:

Contributions to the Boise River near Parma

20 18 16 31 15

Suspended Sediment – Mid-irrigation Event

Fivemile Creek Tenmile Creek Mason Creek Indian Creek* Other 13 8 9 55 15

Total Phosphorus – Mid-Irrigation Event

Fivemile Creek Tenmile Creek Mason Creek Indian Creek* Other

*Results shown for Indian Creek at Simplot Blvd (I2)

slide-8
SLIDE 8

Provisional Results

Fivemile and Tenmile Creeks

  • Bacteria
  • Fivemile and Tenmile at Franklin Rd
  • Median irrigation season E. Coli >300 (N=20)
  • Indian Creek
  • Median irrigation season E. Coli = 310 (N = 37)
  • Mason Creek
  • Median irrigation season E. Coli = 470 (N = 37)
slide-9
SLIDE 9

Provisional Results

Mason Creek Expanded Monitoring and Models

  • Streamgage + Continuous Turbidity & Temp
  • Regression models (surrogates)
  • 15-minute estimates
  • Loads
  • Mass/time/ac, mass/time
  • Concentrations
  • Potential for real-time estimates
slide-10
SLIDE 10

Provisional Results

Phosphorus Surrogate

slide-11
SLIDE 11

Provisional Results

Sediment Surrogate

slide-12
SLIDE 12

Provisional Results

Application of Surrogate

4,000 5,000 6,000 7,000 8,000 9,000 10,000 11,000 12,000 13,000 14,000

Aug 01 Aug 03 Aug 05 Aug 07 Aug 09 Aug 11 Aug 13 Aug 15

Suspended sediment load, (lbs/hour)

Estimated Suspended Sediment Load

2011

slide-13
SLIDE 13

Provisional Results

Application of Surrogate, cont.

  • Estimate 12,100 ton/yr sediment load
  • ~23,180 ac in crop in watershed
  • 1,044 lb/ac sediment runoff
  • Assuming all runoff from irr. land
  • Estimate 31 ton/yr TP load
  • 2.67 lb/ac TP runoff
slide-14
SLIDE 14

Provisional Results

More Potential for Surrogates

  • Fivemile and Tenmile Creeks at Franklin Rd
  • FM: TP, TN, Sed
  • TM: Sed, E. Coli
  • Turbidity may help, no data
  • Indian Creek
  • Simplot Blvd - need more data
  • At mouth – mixing a problem
  • Dixie Drain, Conway Gulch, others?
slide-15
SLIDE 15

Provisional Results

Fish & Invertebrates in Mason Creek

  • 26 caught
  • 7 trout
  • 2 weatherfish
  • Invertebrates dominated by NZ Mudsnail
slide-16
SLIDE 16

Provisional Results

slide-17
SLIDE 17

Provisional Results

WY2012 and 2013 Data Collection

  • 2012 - Eagle Drain and Dry Creek
  • Continuous monitors, SC, temp, DO, turbidity
  • Stream gages
  • Biology
  • No report planned
  • 2013 – Mainstem monitoring completed
  • Potential for daily TP load model at Glenwood,

Middleton, and Parma

  • No report planned
slide-18
SLIDE 18

Provisional Results

2014 Data Collection and Analysis

  • Collect samples at Parma
  • Install continuous monitor at Parma
  • Publish real-time estimates TP and SSC
  • nrtwq.usgs.gov/id/
  • Parma - Model weighted regression on time,

discharge, and load 1980s – present

  • No report planned
slide-19
SLIDE 19

Provisional Results

Summary

  • Tributary Report due ~June 2014
  • Reporting needed
  • 2012 – Beneficial uses Eagle Drain, Dry Creek
  • 2013 – TP & SSC TMDL support, load models
  • 2014 – WRTDS model findings
  • Ongoing support of TMDL monitoring

possible, sediment & TP

  • Parma
  • Mason Creek
  • Others?
slide-20
SLIDE 20

Provisional Results

Discussion