
SLIDE 1
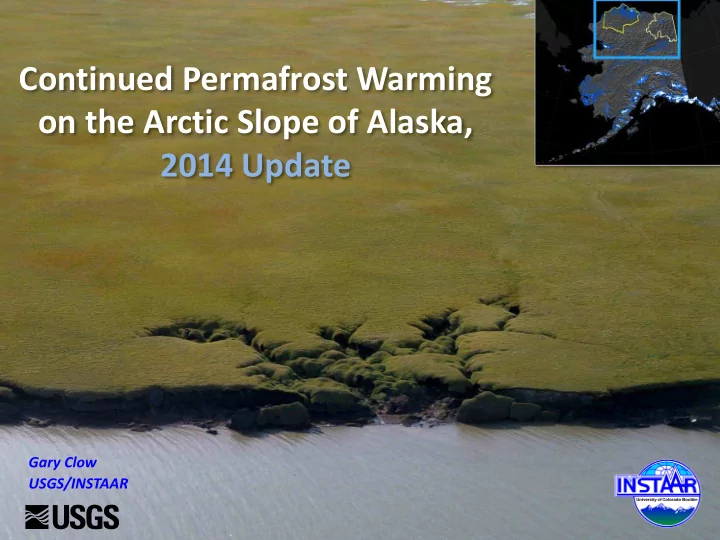
Continued Permafrost Warming
- n the Arctic Slope of Alaska,
2014 Update
Gary Clow USGS/INSTAAR
Continued Permafrost Warming on the Arctic Slope of Alaska, 2014 - - PowerPoint PPT Presentation
Continued Permafrost Warming on the Arctic Slope of Alaska, 2014 Update Gary Clow USGS/INSTAAR Alaska Climate Divisions Bieniek et al. (2014) Statewide Air-Temperature Anomaly dT = +0.9 K 5-yr running ave Bieniek et al. (2014) Statewide
Gary Clow USGS/INSTAAR
Bieniek et al. (2014)
5-yr running ave
Bieniek et al. (2014) dT = +0.9 K
5-yr running ave
Bieniek et al. (2014)
5-yr running ave
Bieniek et al. (2014)
NSIDC/NOAA Sep-2011
Air temperature reanalyses produced using the WRF model, 3.3-km resolution.
Warm Chukchi sector Cool Chukchi sector Cool NPR-A / Warm Arctic NWR NE wind A common pattern
Chukchi Sea Beaufort Sea
ground temps soil moisture wind snow depth rainfall air temp radiation telemetry
+1.63 +1.44 +0.70 +0.87 +0.27 +0.92
Chukchi Sea Beaufort Sea
+1.63 +1.44 +0.70 +0.87 +0.27 +0.92
Chukchi Sea Beaufort Sea
Atmosphere Active Layer (thaws in summer) Permafrost 30 cm
+1.63 +1.86 +1.44 +1.62 +0.70 +1.48 +0.87 +0.66 na +1.46 +0.27 +0.36 +0.92 +0.65
air active layer
Maximum Active-layer Depth
Year Depth (cm)
Active-layer Freeze-up Date
Day of Year Year
Snow Depth
winter trend +10.8 cm / decade
Snow Depth (cm)
Fish Creek Fish Creek Fish Creek
Chukchi Sea
Beaufort Sea
Chukchi Sea
Beaufort Sea
1980
1981
1983
1984
1989
2002
2007
2012
2012
20-m temps
+2.4°C warming since 1980 +2.9°C warming since 1989 1989 1980
ESN, Beaufort Coast
+1.8°C
Depth (m) Temperature (°C)
FCK, Coastal Plain TLK, Chukchi Coast
Depth (m) Depth (m) Temperature (°C)
SME, Coastal Plain
Depth (m) Temperature (°C)
2012 2012 2012
+1.9°C +2.4°C
2012
+2.9°C
Chukchi Sea
Beaufort Sea
Chukchi Sea Beaufort Sea
Permafrost
Active Layer Continuous Permafrost Discontinuous Permafrost
Permafrost
Active Layer Continuous Permafrost Discontinuous Permafrost
T
air = -8°C
Tg = -5°C
mean-annual
Chukchi Sea Beaufort Sea