
SLIDE 1
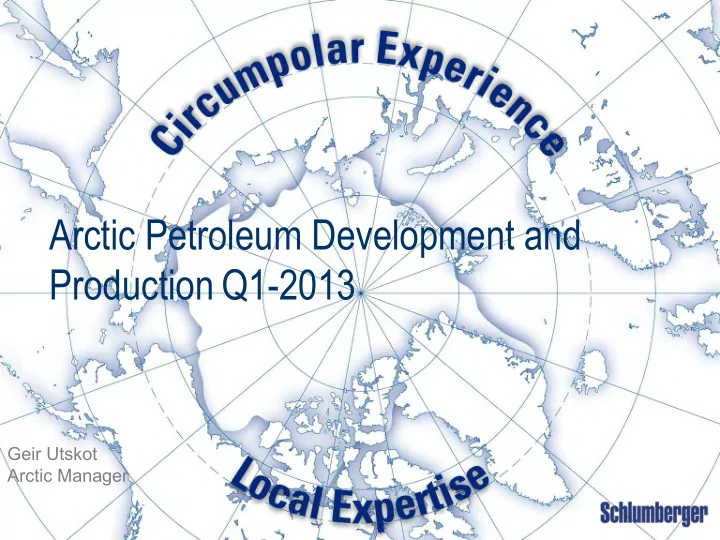
Arctic Petroleum Development and Production Q1-2013
Geir Utskot Arctic Manager
Arctic Petroleum Development and Production Q1-2013 Geir Utskot - - PowerPoint PPT Presentation
Arctic Petroleum Development and Production Q1-2013 Geir Utskot Arctic Manager Overview Arctic resources Forecasted activity 2012 to 2017 Existing Arctic Developments What does this mean in our part of the world? Some Discovery to Production
Geir Utskot Arctic Manager
2
3 Statoil 2009
4
Wells per region & type 2012 2013 2014 2015 2016 2017 Total # of wells NAM Exploration 4 6 12 10 12 14 58 NAM Development Norway Exploration 8 8 10 10 10 10 56 Norway Development 3 12 17 17 25 28 102 Russia Exploration 4 6 6 12 14 42 Russia Development 5 8 11 10 11 7 52 Wells per year 20 38 56 53 70 73 310 Wells per region 2012 2013 2014 2015 2016 2017 Total # of wells NAM Exploration 1 6 10 12 14 43 NAM Development Norway Exploration 8 14 10 10 10 10 62 Norway Development 3 5 5 5 11 18 47 Russia Exploration 4 6 6 12 14 42 Russia Development 5 8 11 10 11 7 52 17 31 38 41 56 63 246
5
7
http://www.rosneft.com/attach/0/16/40/fact_sheet_arctic_blocks_eng.pdf
Estimated to be 5 times the size of
US Bakken
In areas with existing oil and gas
infrastructure
Yet the full scale of its riches remains a
conservative three billion metric tons, or over 20 billion barrels, to as much as 143 billion metric tons, according to a survey of Russian research by oil consultants IHS Cera. The upper estimate would mean an extraordinary one trillion barrels, nearly four times the size of Saudi Arabia's oil reserves
consumption.
8
Subsea to beach
(140km), CCS, LNG
Est. Cost > $12 B Snohvit LNG expansion
put on hold – another 3.5 Tcf needed
9
Subsea production, Sevan Production
Storage Unit, tankers to market, Gas reinjection, Electrical power from land to run the platform to reduce CO2 emissions from platform
Est. Cost $6.4 B
10
In 2011-2012 Statoil and its partners
discovered Skrugard and Havis, which are two independent structures within the same licence and represent the Skrugard field development. 400-600 million barrels of recoverable oil have been proven in this area.
To be producing in 2018, subsea
development, floating processing unit, 280 km pipeline to shore, Statoil
11
Originally Gazprom 51%, Total 25%,
Statoil 24%
Super Giant Gas Field - 135 Tcf Est. cost >$20 Billion Phase 1 of 3: 16 - 20 subsea wells Floating LNG Production Unit 550km subsea pipeline Delayed due to low gas prices Statoil pulled out of JV, re-entering? Tender issued for FEED of LNG plant
at Teriberka outside Murmansk
Shell and Gazprom announced JV GTL would be very easy to ship
12
Bovanekovskoye
and increase to 10- 13 Bcf/d
Yamal LNG
mmcf/d and triple to 2 bcf/d by 2020
13
14
15
16
17
Many existing fields (Hopedale and Saglek) are within the pipeline distance from the Snohvit subsea field to Melkoya LNG plant. The newly discovered basins would currently most likely require floating processing units
18
Country Field Discovery Start Development Start Production Discovery to Production
Canada Norman Wells 1921 1980 1985 64 Canada Bent Horn 1974 1980 1985 11 Canada Amauligak 1984 2023 2027 43 Norway Snohvit 1984 2001 2006 22 Norway Goliat 2000 2012 2014 14 Norway Skrugard/Havis 2011 2016 2018 7 Russia Shtokman 1988 2016 2022 34 Russia Bovanenkovskoye 1971 2008 2012 41 Russia Tambeyskoye 1974 2011 2018 44
Red numbers are guesses
19
Seabed Rig
Under water drilling rig
Badger Explorer
Rig less drilling
North Energy
Tunnel to Oilfield
Boeing & SkyHook
Airships
20
21 Technip High North Experience
Source: Technip
Flexibles - Monitoring
Measurement-enabled flexible pipe ► Joint development of advanced flexible pipe integrity and surveillance with Schlumberger
A new generation of intelligent flexible pipe Rigid - Heated Pipe-in-Pipe
Extension of current technology to include possibility for active heating of flowline system ► HPIP qualified for reeling,
efficiency in combination with lower power requirements
Excellent flow assurance performance Flexibles - 3,000 meters
Extend flexible risers water depth and pressure capability to 3,000 meters and beyond through innovative solutions ► Initial results from ultra-deep
flexible pipe for sweet and sour service were successful
Towards 3,000 meters and beyond
Drive growth: enabled by technological innovation
22
23
FPSO Subsea Manifold Umbilical FPSO Single Line ETH- PiP Umbilical ETH In-Line Tee Subsea Manifold
24
Pressure = Wellhead Flowing Pressure (WHFP) Production Period [Years] N N+n Production Time Extension Planned Production Time ΔP Reduction 100 bar Range
DP/DT ≈ 1.0 – 2.0 bar/year range
at end of field life, any improvement in hydraulic performance of flowline i.e. reduction of pressure drop, could substantially increase wellhead production period.
25
Technip Slide Library 26
Existing reach from FPSO to subsea trees is typically 10 km radius, 20 km diameter
Technip Slide Library 27
Future reach from FPSO to subsea trees (with heat traced Pipe-in-Pipe is typically 35 km radius, 70 km diameter
In 2003, the project cost was estimated to be US$5 billion. Because Shell's contract provided them with the input gas for free, the project was calculated to be viable once the price of
Location: Qatar, Ras Laffan Industrial City Integrated gas and gas-to-liquids project Development and Production Sharing Agreement with Government of the State Qatar, 100% Shell funding Development cost: $18 billion-$19 billion Production: 1,6 bcf/d of gas (291,598 boe/d) resulting in: 140 kbo/d of GTL products (2 trains); gasoil, kerosene, naphtha, normal paraffin and base
120 kbo/d of NGL and ethane Total production: 3 billion boe of natural gas over the life of the project Key contractors: JGC/KBR joint venture
28
(a.k.a. Northern Sea Route, NSR)
70 expected in 2012 but only 46 sailed (1.3 million tons of goods)
compared to 69 in the first 100 years from 1906.
Japan in Nov-2012.
29
2012 •
We sailed our seismic vessel out the NWP this summer from Canadian Beaufort Sea
at improving emergency preparedness and search and rescue capacity.
30