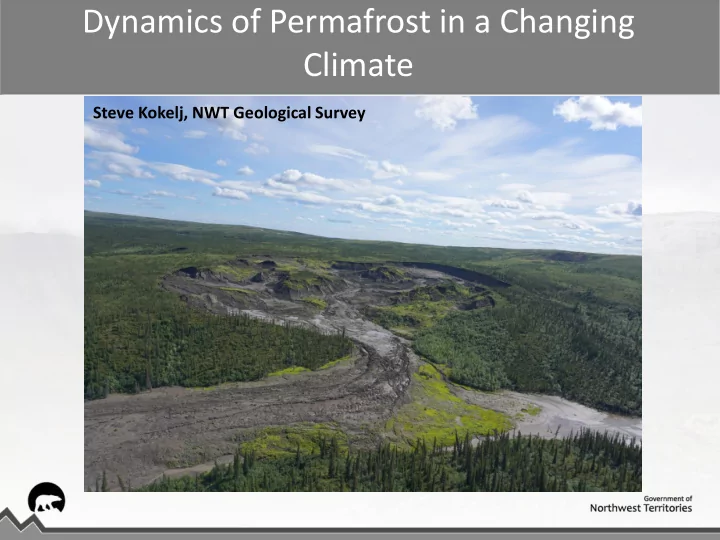
SLIDE 1 Dynamics of Permafrost in a Changing Climate
Steve Kokelj, NWT Geological Survey
SLIDE 2 Permafrost and the environment
People and Wildlife
Permafrost
SLIDE 3 Canada is a permafrost country
Heginbottom, 1995
SLIDE 4 400 200 300 100
from S Wolfe, NRCan
Permafrost thickness
SLIDE 5 Active layer
Active layer Post-disturbance active layer Ice-rich permafrost Surface subsidence
SLIDE 6 Active layer and permafrost
Active layer Near-surface permafrost Ice-rich zone
SLIDE 7
Ground temperatures in permafrost
SLIDE 8 Relations between air and ground temperatures
SLIDE 9 The influence of water bodies
Lake 3oC Talik (unfrozen) MAGT
SLIDE 10 Lake 5oC Talik (unfrozen) MAGT
Lake 3oC Talik (unfrozen) MAGT
Talik adjustment due to warming and shoreline instability
Cold permafrost Warm permafrost
Massive ice
SLIDE 11
Warming permafrost, talik adjustment and lake bottom subsidence
SLIDE 12 Shoreline stability
INF
SLIDE 13
The world of underground ice
SLIDE 14 Near-surface ice lenses
Surface disturbance – increased thaw depth = Surface subsidence
Ice-rich permafrost Active layer Active layer
SLIDE 15
Drunken forest = ice-rich terrain
SLIDE 16
Tundra polygons
SLIDE 17 Ice-wedge ice
Thermal- contraction crack
Photo from CR Burn French, 1996
SLIDE 18 Polygonal terrain
Polygon Trough
SLIDE 19
Polygonal terrain
SLIDE 20 Massive ground ice
Massive tabular ice
SLIDE 21
Massive ice and retreat of Laurentide ice sheet
SLIDE 22
Climate warming and permafrost
SLIDE 23 Warming air temperatures
SLIDE 24 Hay River & Inuvik Mean Annual Temperatures
24
Hay River = 3oC per 100 years Inuvik = 7oC per 100 years
SLIDE 25 Future Climate Projections
Potential increase in winter temperatures 11.6 °C from -28.6 to -16.3 http://tinyurl.com/snap-nwt
SLIDE 26 Projections of mean annual temperature made in 2003
Climate interval
Mean annual temperature (C)
51-80 61-90 71-00 81-10 10-39 40-69 Dawson Inuvik
1987-2016 1987-2016 Upper forecast Lower forecast
From CR Burn; Camsell Lecture, 2017
SLIDE 27 Projections of summer rainfall made in 2003
From CR Burn; Camsell Lecture, 2017
SLIDE 28 Permafrost is warming
1970 2005
Mackay, 1974; GSC Burn and Kokelj, 2009; PPP
SLIDE 29 Chadburn et al., 2017; Nature Climate Change
Permafrost change under future scenarios
SLIDE 30 Mean annual ground temperature profiles
Wolfe et al. 2015 GeoQuebec
Yellowknife region Inuvik Quarry – Navy Road
Burn et al., 2009, PPP
SLIDE 31
Landscapes are responding to warmer and wetter conditions
SLIDE 32
Eastern Banks Island
1960s
SLIDE 33
2005
Eastern Banks Island
SLIDE 34 2016
Rudy et al., 2017 GRL
Eastern Banks Island
SLIDE 35
Increasing late season precipitation and landsliding
SLIDE 36
Increasing fall precipitation (9 years since 2002 in top 16)
SLIDE 37
Reindeer Station landslides occur after heavy rains, September 2017
SLIDE 38
Reindeer Station landslides occur after heavy rains, September 2017
SLIDE 39 Capacity to develop geohazard risk maps are increasingly important for safety of residents and for planning infrastructure
Rudy et al., NWT Geoscience Forum, 2017
SLIDE 40
How will the landscape respond?
SLIDE 41 Impacts to northern infrastructure
41
2015
Fill Tongue Slumps Failure precursor
2016
Embankment Failure
SLIDE 42
SLIDE 43
Embankment fill
2015
SLIDE 44 Displacement vectors 1 Year movement
SLIDE 45 Monitoring, analysis, informed decisions and adaptation
45
SLIDE 46 Inuvik to Tuktoyaktuk Highway Geotechnical legacy and informed decisions
Thermal monitoring Several hundred geotechnical boreholes Remote sensing and terrain data Stream water quality
SLIDE 47 Management of permafrost geotechnical, ground temperature and geohazard data
Available ground temperature monitoring data Potential ground temperature monitoring data
SLIDE 48 Summary
- Permafrost is the geological manifestation of climate and provides
foundation for billions of dollars of northern infrastructure and ecosystems
- The state of permafrost is being altered by climate warming
- Some permafrost landscapes are inherently susceptible to change
- Consider uncertainty and anticipate encountering conditions without
precedent
SLIDE 49 Summary
- Information on permafrost temperature and geotechnical properties is
critical for design and mitigation
- Assessing geohazards and risk related to permafrost thaw is critical for
public safety and for informed design
- Monitoring can inform mitigation and future design
- Managing this information is a foundational activity
SLIDE 50 Summary
- Expect surprises, consequence of a poor knowledge base will be bigger
and more costly surprises
- Interaction between Engineers and Geoscientists will lead to advances in
knowledge, design and adaptation
- Resilience – build in flexibility and develop multiple options to deal with
change and uncertainty
SLIDE 51
Summary
Training and capacity is required
SLIDE 52
Thank you