
SLIDE 1
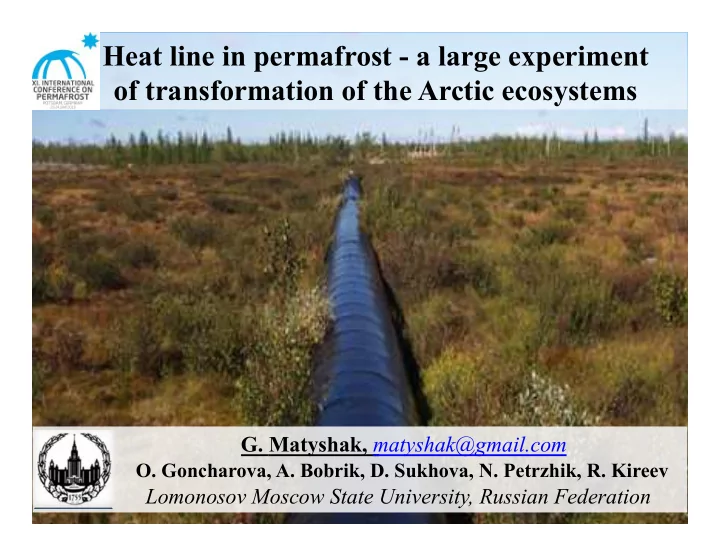
Heat line in permafrost - a large experiment
- f transformation of the Arctic ecosystems
- G. Matyshak, matyshak@gmail.com
- O. Goncharova, A. Bobrik, D. Sukhova, N. Petrzhik, R. Kireev