
SLIDE 1
Urban hydrology
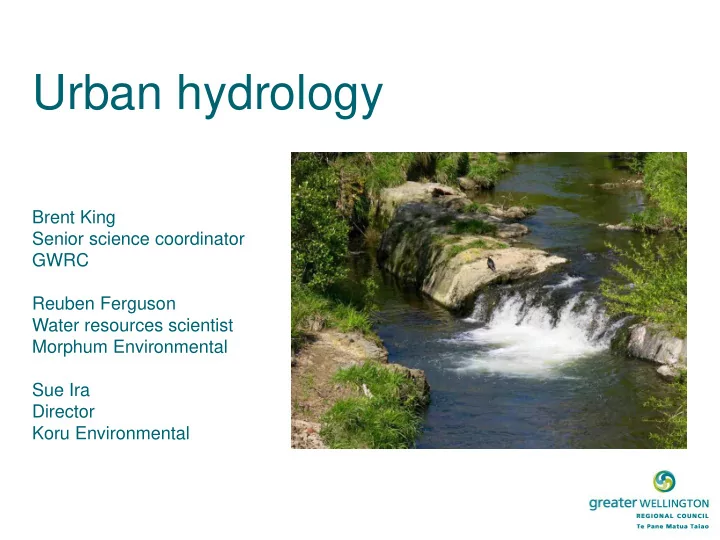
Brent King Senior science coordinator GWRC Reuben Ferguson Water resources scientist Morphum Environmental Sue Ira Director Koru Environmental
Urban hydrology Brent King Senior science coordinator GWRC Reuben - - PowerPoint PPT Presentation
Urban hydrology Brent King Senior science coordinator GWRC Reuben Ferguson Water resources scientist Morphum Environmental Sue Ira Director Koru Environmental Aim of the session Identify the Committees preferences for managing
Brent King Senior science coordinator GWRC Reuben Ferguson Water resources scientist Morphum Environmental Sue Ira Director Koru Environmental
– more runoff – faster runoff
– Slow the water down – Limited removal of runoff reaching the stream
– Reduce the area of hard surfaces – Slow the water down – Store and remove runoff from reaching the stream
– changes indicate a likely shift in the stream ecology towards less diverse macroinvertebrate communities with fewer sensitive species
– too much disturbance can mean only the tolerant species (typically the small and rapidly species colonising species) survive while sensitive species are lost
– Difference in costs to install and maintain the scenario bundles of stormwater mitigation measures – Split of private and public borne costs
TE AWARUA-O-PORIRUA WHAITUA
Greenfield Infill
– Rainwater tanks (reuse of captured water) – Raingardens in streets – Wetlands (reuse of treated water) – Permeable paving
Greenfield Infill
Greenfield
BAU to WSUD: 53% Improved: 10% WSUD: 43%
Infill
BAU to WSUD: 42% Improved: 6% WSUD: 37%
% volu
Greenfield Infill
At t 95% Existing: 6 L/s BAU: 20 L/s Improved: 12 L/s WSUD: 5 L/s
PORIRUA WHAITUA
Definition:
“…..the process of assessing the cost of a
product over its life cycle or a portion thereof…..”
Ref: Australian/New Zealand Standard 4536:1999 Treasury New Zealand
Phases in the life cycle of a stormwater practice and potentially associated costs (Taylor, 2003) $ Cost
maintenance costs over a 50 year analysis period (base date of 2017)
in costs (focus on ranges rather than absolutes)
dwellings in our two case studies only.
$260,000 $850,000 $144,000 $480,000 $290,000 $670,000 $201,000 $495,000 $- $100,000 $200,000 $300,000 $400,000 $500,000 $600,000 $700,000 $800,000 $900,000 Low High Low High CAMBORNE GREENFIELDS CASE STUDY KENEPERU INFILL CASE STUDY
TOTAL INDICATIVE ESTIMATE LCC $/ YEAR
IMPROVED SCENARIO WSUD SCENARIO
$360 $1,100 $40 $140 $400 $900 $60 $150 $- $200 $400 $600 $800 $1,000 $1,200 Low High Low High CAMBORNE GREENFIELDS CASE STUDY KENEPERU INFILL CASE STUDY
TOTAL INDICATIVE ESTIMATE LCC $/YEAR/DWELLING
IMPROVED SCENARIO WSUD SCENARIO
$360 $1,100 $40 $140 $400 $900 $60 $150 $- $200 $400 $600 $800 $1,000 $1,200 Low High Low High CAMBORNE GREENFIELDS CASE STUDY KENEPERU INFILL CASE STUDY
TOTAL INDICATIVE ESTIMATE LCC $/YEAR/DWELLING
IMPROVED SCENARIO WSUD SCENARIO
81% 19%
CAMBORNE GREENFIELD CASE STUDY - IMPROVED SCENARIO Proportion of total LCC as public or private
Public portion of total LCC$/yr Private portion of total LCC$/yr
59% 41%
CAMBORNE GREENFIELD CASE STUDY - WSUD SCENARIO Proportion of total LCC as public or private
Public portion of total LCC$/yr Private portion of total LCC$/yr
81% 19%
KENEPERU INFILL CASE STUDY - IMPROVED SCENARIO Proportion of total LCC as public or private
Public portion of total LCC$/yr Private portion of total LCC$/yr
57% 43%
KENEPERU INFILL CASE STUDY - WSUD SCENARIO Proportion of total LCC as public or private
Public portion of total LCC$/yr Private portion of total LCC$/yr
scenarios
scenarios are relatively small
particularly for the ‘improved scenario’
catchment scale methods to slow water down
costs from the higher use of lot scale retention and in home reuse