
SLIDE 1
1
Hydrology for Construction Site Erosion Control
Robert Pitt Department of Civil and Environmental Engineering University of Alabama Tuscaloosa, AL
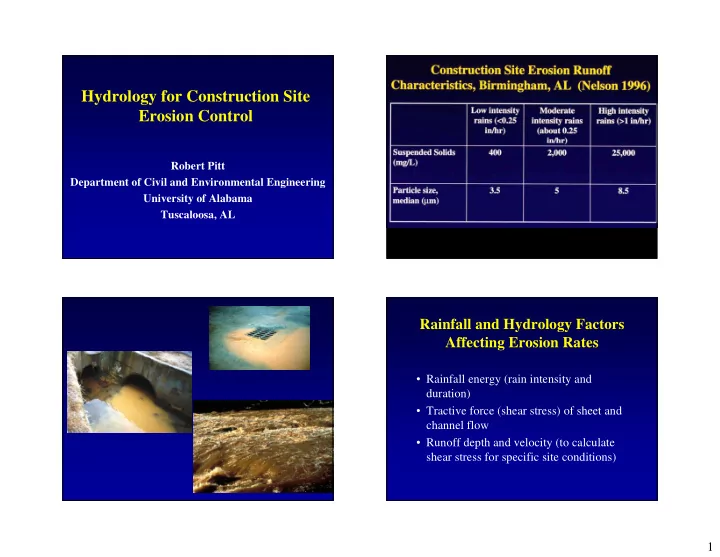
Rainfall and Hydrology Factors Affecting Erosion Rates
- Rainfall energy (rain intensity and
duration)
- Tractive force (shear stress) of sheet and
channel flow
- Runoff depth and velocity (to calculate