
SLIDE 1
CHI-FRB Indy June 10, 2009
ECONOMIC OUTLOOK
Weathering the Storm
Timothy Slaper, Ph.D. Director of Economic Research Indiana Business Research Center Kelley School of Business, Indiana University
- 8
- 6
- 4
- 2
2 4 6
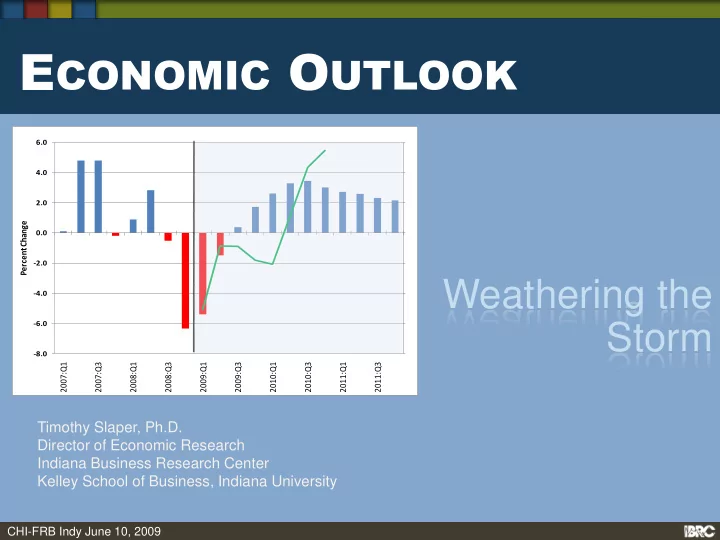
- 8.0
- 6.0
- 4.0
- 2.0
0.0 2.0 4.0 6.0
2007:Q1 2007:Q3 2008:Q1 2008:Q3 2009:Q1 2009:Q3 2010:Q1 2010:Q3 2011:Q1 2011:Q3 Percent Change