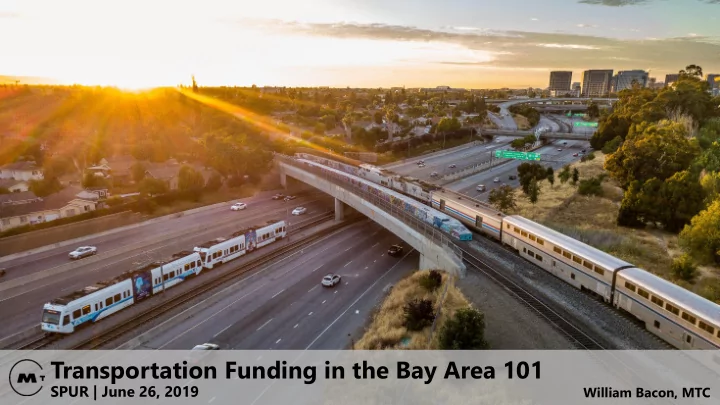

Transportation Funding in the Bay Area 101 SPUR | June 26, 2019 William Bacon, MTC
(Maclek Lulko) San Francisco Bay Area 7.7 million residents 27 min. average drive-alone commute 49 min. average transit commute 3.9 million jobs +19% since 2010 48% of all jobs are in SF, SJ, and northern Santa Clara County SF and all of Santa Clara County are home to 37% of residents 2
Streets and Roads in the Bay Area 42,500+ lane miles of local streets Eight toll bridges 151,300,000+ daily vehicle miles traveled (VMT) 3.7% of commuters bike to work region-wide 8.2% in Berkeley 0.9% in San Jose, the Bay Area’s largest city 3 Jim Mauer
Transit in the Bay Area 25 transit operators 1.8 million daily transit trips in 2018 Per capita transit ridership is down 11% over the last 25 years 80% of transit trips are on the three largest operators (SFMTA, BART, AC Transit) 4 Jim Mauer
So how do we fund it all? Photo: Michael Estigoy
Where does the Bay Area Get Its 6 Transportation Funding? Anticipated Project Funding (Source TBD) 5% Private/Other 5% Federal 11% $309 Billion over the 24 years Local From FY 2016/17 to 2039/40 51% Regional 13% State 15%
Key Transportation Funding Decision Makers Federal Highway Administration (FHWA) and Federal Transit Administration (FTA) Federal Funds Caltrans MTC California Legislature California Transportation Commission (CTC) California Air Resources Board (CARB) State Funds Caltrans California State Transportation Agency (CalSTA) MTC MTC and Bay Area Toll Authority (BATA) Congestion Management Agencies (CMAs) Regional & Local Funds Transit Operators City/County Governments 7
Revenue Generation — Simplified $ CA Diesel* County/Transit CA Statewide Federal Fuel Excise Tax CA Fuel Excise Tax* Sales Tax Option Sales Tax 18.4 ¢/gal gas 47.3¢/gal gasoline 10.5% Transportation 0.25% 24.4 ¢/gal diesel 36¢/gal diesel Sales Taxes Up to 1.5% total Program Set-Asides (ATP, Federal Planning, Culverts, LPP, etc.) General Fund State Public Local County Local Highway Highway Roads Transportation transportation Transportation Trust Fund Account Account authorities Fund and/or transit operators 85% 15% e.g. SF Prop K, Transit Highway BART, SC & SM SHOPP STIP STA TDA Account Account permanent transit sales Other Revenue Generators: taxes, etc. FTA FHWA • State – Cap & Trade Programs Programs • Regional – Tolls • Registration Fees/Taxes Rail (SB1) • Transportation Improvement Fee (SB1 – 8 RMRA, Congested Corridor, Transit )
Funding Sources: Federal Annual Revenue Amounts — FY 2018/19 $250 Discretionary – Varies Annually: $224 FTA 5309 – New & Small Starts $200 $207 BUILD – Freight & Highway Competitive Grants One Bay Area Grant (OBAG) Millions $150 $100 $98 $70 $50 $20 $0 FTA: Urbanized Area FTA: State of Good Surface Transportation Congestion Mitigation FTA: Other Formula Funds Repair Program (STP) & Air Quality (CMAQ) Programs 9
Funding Sources: State Annual Revenue Amounts — FY 2018/19 $500 $520 $480 $400 Millions $300 $251 $200 $140 $100 $130 $69 $55 $0 State Highway Gas Tax State State Transit Cap & Trade: Cap & Trade: Cap & Trade Operation & Subventions Transportation Assistance (STA) LCTOP* TIRCP* AHSC* Protection Improvement Program Program (STIP) (SHOPP) * Amounts may vary widely year to year 10
Funding Sources: Local & Regional Annual Revenue Amounts — FY 2018/19 $1,400 Millions $1,200 $1,200 $1,000 $980 $800 $600 $653 $400 $420 $390 $200 $170 $150 $130 $24 $0 Temporary Transit Fares Permanent TDA Seismic Retrofit Property Taxes RM 1 Bridge RM 2 Bridge Air District Sales Tax Sales Tax Bridge Tolls Tolls Tolls (TFCA) 11
Transit Farebox Recovery Ratio, FY 2017-18 80% 70% 60% 50% 40% 30% 20% 10% 0% Source: Preliminary Audited Financial Statements, FY 2017-18
Real Sales Tax Revenue: 6% Drop Since 2000 TDA ¼ Cent Sales Tax, Bay Area $80 $500 $458 Millions of $ per 1 Million in Population $450 $429 $70 $400 $60 $350 $50 Millions $300 $40 $250 $200 $30 $150 $20 $100 $10 $50 $54 $63 $55 $41 $51 $55 $0 $0 FY 1990-91 FY 2000-01 FY 2005-06 FY 2009-10 FY 2018-19e Per Capita, FY 2017-18 $ Real, FY 2018-19 $ Nominal $ Source: 1. Actuals reported by CA Dept. of Tax & Fee Admin. 13 2. FY 2018-19 estimates from FY 2019-20 Fund Estimate
The “Color of Money” and What It Can Fund TDA STA RM2 OBAG TCP ATP C&T STIP X X X X X Transit Operating X X X X X X X Transit Capital X X Streets & Roads Hwys & Regional X X X Operations X X X X Bike/Ped X Local Planning X X Climate Low-income, senior, X X X X X disabled populations X X Housing 14
Feel free to get in touch with questions William Bacon wbacon@bayareametro.gov 415.778.6628 15
Recommend
More recommend