Total Supply/Consumption Total Supply Consumption Linear (Total - - PDF document

total supply consumption
SMART_READER_LITE
LIVE PREVIEW

Total Supply/Consumption Total Supply Consumption Linear (Total - - PDF document

2007-2008 Crop Year; A Market Overview- presented by Daniel J. Zedan, President, Natures Finest Foods, Ltd., PO Box 17, Wayne, IL 60184; ph: 630-377-2628, fax: 630-377-3250, email: dzedan@aol.com ; website: www.nffonline.com When the USDA


slide-1
SLIDE 1

2007-2008 Crop Year; A Market Overview-presented by Daniel J. Zedan, President, Nature’s

Finest Foods, Ltd., PO Box 17, Wayne, IL 60184; ph: 630-377-2628, fax: 630-377-3250, email: dzedan@aol.com; website: www.nffonline.com

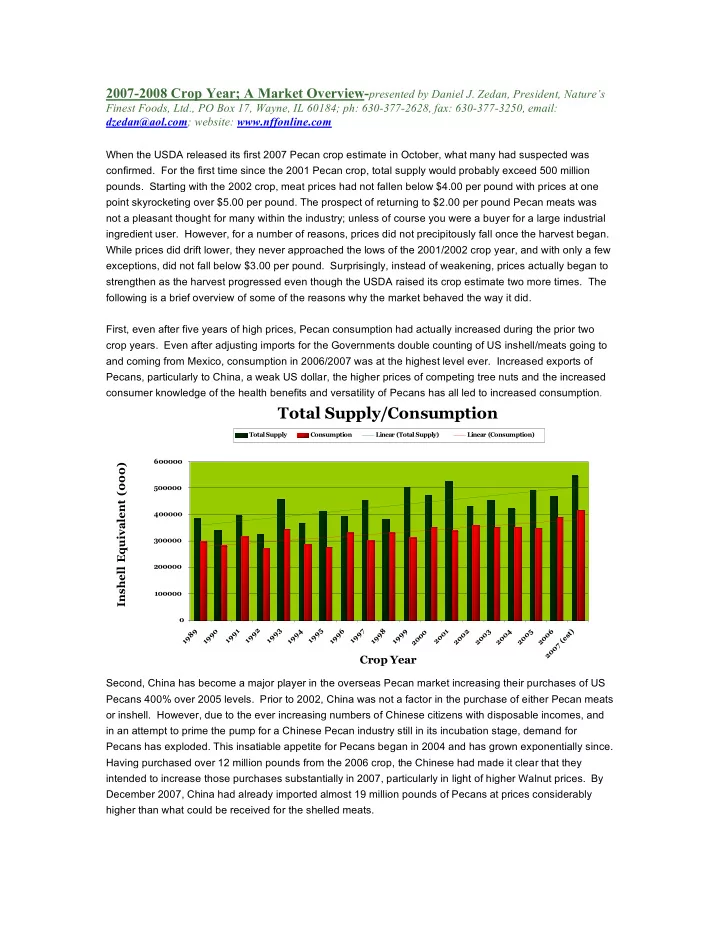
When the USDA released its first 2007 Pecan crop estimate in October, what many had suspected was

  • confirmed. For the first time since the 2001 Pecan crop, total supply would probably exceed 500 million
  • pounds. Starting with the 2002 crop, meat prices had not fallen below $4.00 per pound with prices at one

point skyrocketing over $5.00 per pound. The prospect of returning to $2.00 per pound Pecan meats was not a pleasant thought for many within the industry; unless of course you were a buyer for a large industrial ingredient user. However, for a number of reasons, prices did not precipitously fall once the harvest began. While prices did drift lower, they never approached the lows of the 2001/2002 crop year, and with only a few exceptions, did not fall below $3.00 per pound. Surprisingly, instead of weakening, prices actually began to strengthen as the harvest progressed even though the USDA raised its crop estimate two more times. The following is a brief overview of some of the reasons why the market behaved the way it did. First, even after five years of high prices, Pecan consumption had actually increased during the prior two crop years. Even after adjusting imports for the Governments double counting of US inshell/meats going to and coming from Mexico, consumption in 2006/2007 was at the highest level ever. Increased exports of Pecans, particularly to China, a weak US dollar, the higher prices of competing tree nuts and the increased consumer knowledge of the health benefits and versatility of Pecans has all led to increased consumption.

Total Supply/Consumption

100000 200000 300000 400000 500000 600000 1989 1990 1991 1992 1993 1994 1995 1996 1997 1998 1999 2000 2001 2002 2003 2004 2005 2006 2007 (est)

Crop Year Inshell Equivalent (000)

Total Supply Consumption Linear (Total Supply) Linear (Consumption)

Second, China has become a major player in the overseas Pecan market increasing their purchases of US Pecans 400% over 2005 levels. Prior to 2002, China was not a factor in the purchase of either Pecan meats

  • r inshell. However, due to the ever increasing numbers of Chinese citizens with disposable incomes, and

in an attempt to prime the pump for a Chinese Pecan industry still in its incubation stage, demand for Pecans has exploded. This insatiable appetite for Pecans began in 2004 and has grown exponentially since. Having purchased over 12 million pounds from the 2006 crop, the Chinese had made it clear that they intended to increase those purchases substantially in 2007, particularly in light of higher Walnut prices. By December 2007, China had already imported almost 19 million pounds of Pecans at prices considerably higher than what could be received for the shelled meats.

slide-2
SLIDE 2

Pecan Exports

20000000 40000000 60000000 80000000 100000000 120000000

1989 1990 1991 1992 1993 1994 1995 1996 1997 1998 1999 2000 2001 2002 2003 2004 2005 2006 2007 (est)

Crop Year

Pounds (Inshell Basis)

Total Exports

Exports to China

5000000 10000000 15000000 20000000 25000000 30000000 35000000 40000000 45000000 2002 2003 2004 2005 2006 2007 (est)

Year Pounds (Inshell Basis)

Exports to China

slide-3
SLIDE 3

Exports by Country

20000000 40000000 60000000 80000000 100000000 120000000 2002 2003 2004 2005 2006 2007 (est)

Year Pounds (Inshell Basis)

Exports - Other Countries Exports to Holland Exports to UK Exports to Mexico Exports to Canada Exports to China

Third, of all tree nuts, Walnuts and Pecans are the most interchangeable. When pricing differences get significantly out of balance, large shifts in consumption patterns can occur. For the past several years, and for a variety of reasons, Walnut prices have continued to climb and have recently reached record highs. In addition to a short 2007 crop, the dissolution of the Diamond Walnut Growers Cooperative a few years ago, the change of emphasis from ‘industrial’ to ‘retail’ sales by the new Diamond Walnut Company and the emergence of higher yielding, later harvesting varieties, the industry has been forced to redefine itself. What was once was a very stable industry is now struggling with market forces that it hasn’t had to deal with

  • before. As a result, at one point Light Halves and Pieces were at or above $5.00 per pound and

Combination product sold for as much as $4.60 per pound. Availability of many piece sizes was extremely limited, and as such, many industrial users switched to Pecans. Fourth, the US dollar has hit record lows against the Pound, Euro and Japanese Yen making the purchase

  • f Pecans very attractive.
slide-4
SLIDE 4

Fifth, due to the large size of the 2007 crop and the alternate bearing nature of Pecans, the 2008 crop will probably be very small. Since 1989, Georgia has only produced four off-year crops greater than 60 million

  • pounds. In the same time frame, neither Texas nor New Mexico has produced back to back large crops. As

such, supplies could be very tight in the latter half of 2008 and into 2009; thereby keeping prices very firm. Assuming this to be the case, there was no need for growers to sell product at levels anywhere near those

  • f 2001/2002.

Production by State

20000 40000 60000 80000 100000 120000 140000 160000 1 9 8 9 1 9 9 1 9 9 1 1 9 9 2 1 9 9 3 1 9 9 4 1 9 9 5 1 9 9 6 1 9 9 7 1 9 9 8 1 9 9 9 2 2 1 2 2 2 3 2 4 2 5 2 6 2 7 ( e s t )

Year Millions of Pounds

Georgia New Mexico Texas Linear (Georgia)