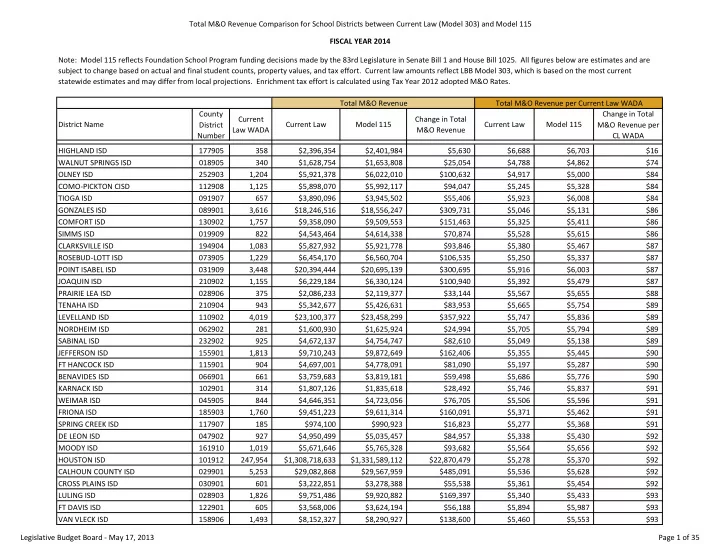
total m o revenue comparison for school districts between
play

Total M&O Revenue Comparison for School Districts between - PowerPoint PPT Presentation

Total M&O Revenue Comparison for School Districts between Current Law (Model 303) and Model 115 FISCAL YEAR 2014 Note: Model 115 reflects Foundation School Program funding decisions made by the 83rd Legislature in Senate Bill 1 and House Bill


  1. Total M&O Revenue Comparison for School Districts between Current Law (Model 303) and Model 115 FISCAL YEAR 2014 Note: Model 115 reflects Foundation School Program funding decisions made by the 83rd Legislature in Senate Bill 1 and House Bill 1025. All figures below are estimates and are subject to change based on actual and final student counts, property values, and tax effort. Current law amounts reflect LBB Model 303, which is based on the most current statewide estimates and may differ from local projections. Enrichment tax effort is calculated using Tax Year 2012 adopted M&O Rates. Total M&O Revenue Total M&O Revenue per Current Law WADA County Change in Total Current Change in Total District Name Current Law Model 115 Current Law Model 115 District M&O Revenue per Law WADA M&O Revenue Number CL WADA HIGHLAND ISD 177905 358 $2,396,354 $2,401,984 $5,630 $6,688 $6,703 $16 WALNUT SPRINGS ISD 018905 340 $1,628,754 $1,653,808 $25,054 $4,788 $4,862 $74 OLNEY ISD 252903 1,204 $5,921,378 $6,022,010 $100,632 $4,917 $5,000 $84 COMO-PICKTON CISD 112908 1,125 $5,898,070 $5,992,117 $94,047 $5,245 $5,328 $84 TIOGA ISD 091907 657 $3,890,096 $3,945,502 $55,406 $5,923 $6,008 $84 GONZALES ISD 089901 3,616 $18,246,516 $18,556,247 $309,731 $5,046 $5,131 $86 COMFORT ISD 130902 1,757 $9,358,090 $9,509,553 $151,463 $5,325 $5,411 $86 SIMMS ISD 019909 822 $4,543,464 $4,614,338 $70,874 $5,528 $5,615 $86 CLARKSVILLE ISD 194904 1,083 $5,827,932 $5,921,778 $93,846 $5,380 $5,467 $87 ROSEBUD-LOTT ISD 073905 1,229 $6,454,170 $6,560,704 $106,535 $5,250 $5,337 $87 POINT ISABEL ISD 031909 3,448 $20,394,444 $20,695,139 $300,695 $5,916 $6,003 $87 JOAQUIN ISD 210902 1,155 $6,229,184 $6,330,124 $100,940 $5,392 $5,479 $87 PRAIRIE LEA ISD 028906 375 $2,086,233 $2,119,377 $33,144 $5,567 $5,655 $88 TENAHA ISD 210904 943 $5,342,677 $5,426,631 $83,953 $5,665 $5,754 $89 LEVELLAND ISD 110902 4,019 $23,100,377 $23,458,299 $357,922 $5,747 $5,836 $89 NORDHEIM ISD 062902 281 $1,600,930 $1,625,924 $24,994 $5,705 $5,794 $89 SABINAL ISD 232902 925 $4,672,137 $4,754,747 $82,610 $5,049 $5,138 $89 JEFFERSON ISD 155901 1,813 $9,710,243 $9,872,649 $162,406 $5,355 $5,445 $90 FT HANCOCK ISD 115901 904 $4,697,001 $4,778,091 $81,090 $5,197 $5,287 $90 BENAVIDES ISD 066901 661 $3,759,683 $3,819,181 $59,498 $5,686 $5,776 $90 KARNACK ISD 102901 314 $1,807,126 $1,835,618 $28,492 $5,746 $5,837 $91 WEIMAR ISD 045905 844 $4,646,351 $4,723,056 $76,705 $5,506 $5,596 $91 FRIONA ISD 185903 1,760 $9,451,223 $9,611,314 $160,091 $5,371 $5,462 $91 SPRING CREEK ISD 117907 185 $974,100 $990,923 $16,823 $5,277 $5,368 $91 DE LEON ISD 047902 927 $4,950,499 $5,035,457 $84,957 $5,338 $5,430 $92 MOODY ISD 161910 1,019 $5,671,646 $5,765,328 $93,682 $5,564 $5,656 $92 HOUSTON ISD 101912 247,954 $1,308,718,633 $1,331,589,112 $22,870,479 $5,278 $5,370 $92 CALHOUN COUNTY ISD 029901 5,253 $29,082,868 $29,567,959 $485,091 $5,536 $5,628 $92 CROSS PLAINS ISD 030901 601 $3,222,851 $3,278,388 $55,538 $5,361 $5,454 $92 LULING ISD 028903 1,826 $9,751,486 $9,920,882 $169,397 $5,340 $5,433 $93 FT DAVIS ISD 122901 605 $3,568,006 $3,624,194 $56,188 $5,894 $5,987 $93 VAN VLECK ISD 158906 1,493 $8,152,327 $8,290,927 $138,600 $5,460 $5,553 $93 Legislative Budget Board - May 17, 2013 Page 1 of 35

  2. Total M&O Revenue Comparison for School Districts between Current Law (Model 303) and Model 115 FISCAL YEAR 2014 Note: Model 115 reflects Foundation School Program funding decisions made by the 83rd Legislature in Senate Bill 1 and House Bill 1025. All figures below are estimates and are subject to change based on actual and final student counts, property values, and tax effort. Current law amounts reflect LBB Model 303, which is based on the most current statewide estimates and may differ from local projections. Enrichment tax effort is calculated using Tax Year 2012 adopted M&O Rates. Total M&O Revenue Total M&O Revenue per Current Law WADA County Change in Total Current Change in Total District Name Current Law Model 115 Current Law Model 115 District M&O Revenue per Law WADA M&O Revenue Number CL WADA WALCOTT ISD 059902 248 $1,171,864 $1,194,934 $23,069 $4,731 $4,824 $93 GRAPELAND ISD 113902 704 $3,911,042 $3,976,749 $65,707 $5,559 $5,652 $93 EZZELL ISD 143906 128 $676,636 $688,618 $11,982 $5,275 $5,369 $93 MCLEOD ISD 034906 631 $3,389,002 $3,447,984 $58,982 $5,372 $5,465 $93 ALBANY ISD 209901 827 $4,449,104 $4,526,389 $77,285 $5,383 $5,476 $93 RIVERCREST 194903 1,079 $6,179,196 $6,280,369 $101,173 $5,725 $5,818 $94 CHILLICOTHE ISD 099902 314 $1,776,847 $1,806,323 $29,476 $5,667 $5,761 $94 HUBBARD ISD (Hill) 109905 614 $3,562,223 $3,620,083 $57,860 $5,798 $5,892 $94 LUBBOCK-COOPER ISD 152906 5,953 $32,582,475 $33,145,383 $562,908 $5,474 $5,568 $95 COMANCHE ISD 047901 1,772 $9,716,943 $9,884,868 $167,925 $5,483 $5,577 $95 MAY ISD 025905 415 $2,275,303 $2,314,611 $39,309 $5,486 $5,581 $95 BUFFALO ISD 145901 1,350 $7,469,126 $7,599,011 $129,886 $5,531 $5,627 $96 MOUNT VERNON ISD 080901 2,064 $11,518,927 $11,717,720 $198,793 $5,582 $5,679 $96 MALAKOFF ISD 107906 1,796 $10,352,436 $10,525,507 $173,071 $5,763 $5,859 $96 DIME BOX ISD 144903 354 $2,188,950 $2,223,051 $34,102 $6,186 $6,282 $96 HIGHLAND PARK ISD (Potter) 188903 1,337 $7,914,463 $8,043,375 $128,912 $5,918 $6,014 $96 HOOKS ISD 019902 1,313 $7,898,813 $8,025,474 $126,661 $6,017 $6,114 $96 LLANO ISD 150901 2,311 $14,773,093 $14,996,238 $223,145 $6,392 $6,488 $97 GATEWAY CHARTER ACADEMY 057831 1,333 $7,333,493 $7,462,315 $128,822 $5,503 $5,600 $97 INSPIRED VISION ACADEMY 057830 1,561 $8,477,967 $8,628,910 $150,943 $5,430 $5,527 $97 SABINE ISD 092906 1,686 $9,078,167 $9,241,413 $163,246 $5,384 $5,480 $97 SEALY ISD 008902 3,414 $18,704,449 $19,036,226 $331,776 $5,479 $5,576 $97 LAPOYNOR ISD 107910 661 $3,826,880 $3,891,182 $64,302 $5,786 $5,883 $97 HAWKINS ISD 250902 1,119 $6,828,275 $6,937,264 $108,988 $6,104 $6,202 $97 A+ ACADEMY 057829 1,551 $8,481,724 $8,633,079 $151,355 $5,470 $5,567 $98 KATHERINE ANNE PORTER SCHOOL 105801 232 $1,396,387 $1,419,025 $22,638 $6,021 $6,118 $98 LA PORTE ISD 101916 9,090 $50,449,937 $51,338,545 $888,609 $5,550 $5,648 $98 POST ISD 085902 1,303 $7,932,933 $8,060,348 $127,415 $6,090 $6,188 $98 FAITH FAMILY ACADEMY OF OAK CL 057815 3,421 $18,723,705 $19,058,537 $334,832 $5,473 $5,571 $98 HENDERSON ISD 201902 4,198 $23,247,768 $23,659,140 $411,372 $5,537 $5,635 $98 ELYSIAN FIELDS ISD 102906 1,462 $8,403,802 $8,547,124 $143,322 $5,749 $5,847 $98 HERMLEIGH ISD 208901 423 $2,445,539 $2,487,062 $41,523 $5,779 $5,877 $98 Legislative Budget Board - May 17, 2013 Page 2 of 35

Download Presentation
Download Policy: The content available on the website is offered to you 'AS IS' for your personal information and use only. It cannot be commercialized, licensed, or distributed on other websites without prior consent from the author. To download a presentation, simply click this link. If you encounter any difficulties during the download process, it's possible that the publisher has removed the file from their server.

Recommend


More recommend