
SLIDE 1
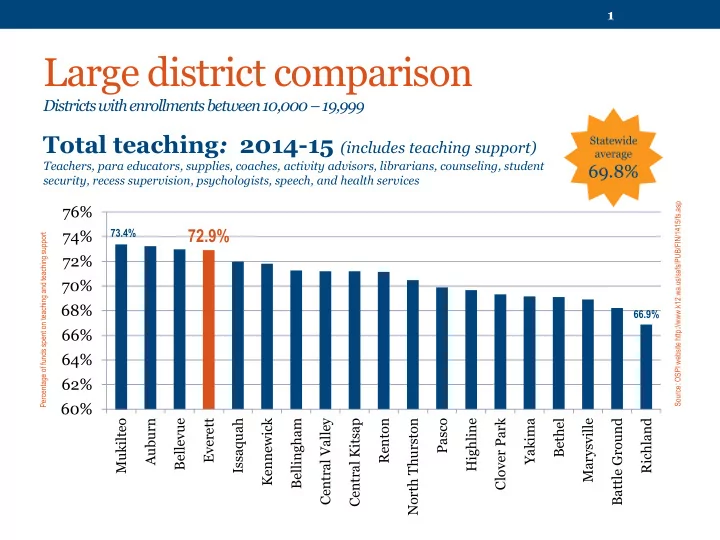
Large district comparison
Districts with enrollments between 10,000 –19,999
Total teaching: 2014-15 (includes teaching support)
Teachers, para educators, supplies, coaches, activity advisors, librarians, counseling, student security, recess supervision, psychologists, speech, and health services
73.4%
72.9%
66.9%
60% 62% 64% 66% 68% 70% 72% 74% 76%
Mukilteo Auburn Bellevue Everett Issaquah Kennewick Bellingham Central Valley Central Kitsap Renton North Thurston Pasco Highline Clover Park Yakima Bethel Marysville Battle Ground Richland
Source: OSPI website http://www.k12.wa.us/safs/PUB/FIN/1415/fs.asp Percentage of funds spent on teaching and teaching support
Statewide average
69.8%
1