
SLIDE 1
Thursday, April 16, 2020 1
Total Confirmed Cases by County Source: PA Dept of Health - - PowerPoint PPT Presentation
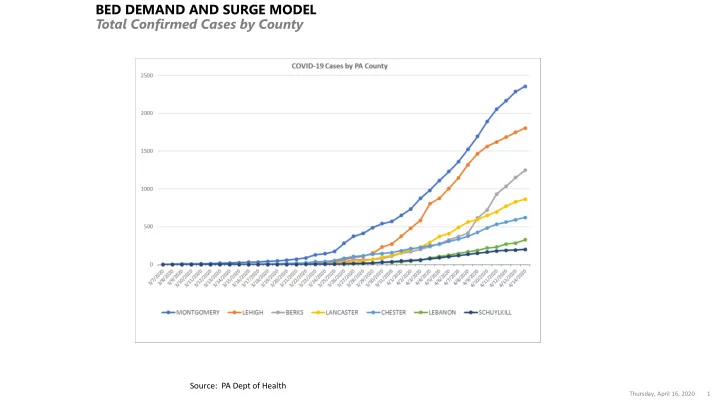
BED DEMAND AND SURGE MODEL Total Confirmed Cases by County Source: PA Dept of Health Thursday, April 16, 2020 1 BED DEMAND AND SURGE MODEL Doubling Rates by County County Doubling Rates Berks Chester Lancaster Lebanon Lehigh Montgomery
Thursday, April 16, 2020 1
Thursday, April 16, 2020 2
Thursday, April 16, 2020 3
Model uses doubling rates of 3.4 DR, 3.9 DR and 4.4 DR to generate 3 potential scenarios
Lower = aggressive infection rate Higher = slowing infection rate due to public health interventions
Selected Hospital:
BERKS COUNTY
First day of model:
4/14/2020
Number of confirmed cases on first day of model:
1247
Modeled number of inpatients on 04/14/20
212 Actual as of 4/14/2020: 161
First Day of ICU Bed Shortage:
4/17/2020 0 weeks, 3 days from 4/14/2020
First Day of Med/Surg Bed Shortage:
4/17/2020 0 weeks, 3 days from 4/14/2020