
SLIDE 1
Note: Totals include Confirmed and CDC Expanded Case Definition - - PowerPoint PPT Presentation
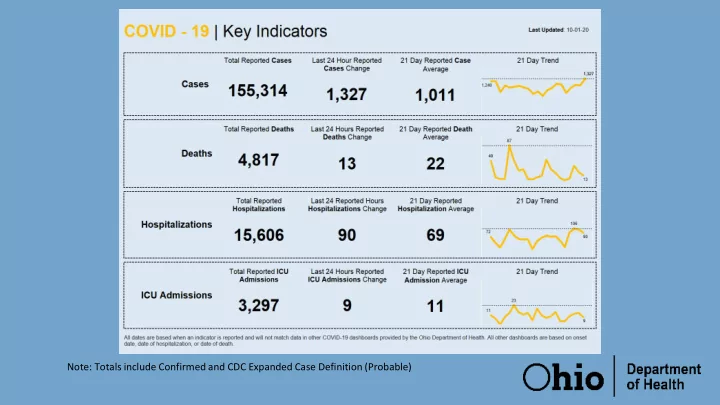
Note: Totals include Confirmed and CDC Expanded Case Definition (Probable) Cases, Hospitalizations, and Deaths in September Cases per Hospital Cases per Hospital Cases per Hospital County Cases Admissions Deaths Population County Cases
County Cases per Capita Cases Hospital Admissions Deaths Population Putnam 688.1 233 30 5 33,861 Mercer 631.5 260 15 1 41,172 Athens 532.7 348 2 65,327 Shelby 522.7 254 11 5 48,590 Wood 424.3 555 30 4 130,817 Henry 407.3 110 11 9 27,006 Butler 402.7 1,543 50 21 383,134 Darke 393.2 201 13 5 51,113 Lawrence 390.2 232 29 6 59,463 Auglaize 385.5 176 17 3 45,656 Madison 380.0 170 7 1 44,731 Miami 370.1 396 23 4 106,987 Pike 345.7 96 6 27,772 Franklin 337.9 4,449 115 20 1,316,756 Pickaway 325.0 190 8 2 58,457 Defiance 322.9 123 14 4 38,087 Union 310.2 183 3 1 58,988 Montgomery 309.0 1,643 173 22 531,687 Greene 303.7 513 26 11 168,937 Clark 303.5 407 5 9 134,083 Jackson 302.3 98 8 5 32,413 Warren 295.0 692 49 13 234,602 Delaware 279.7 585 6 1 209,177 Allen 264.8 271 33 12 102,351 Fulton 263.5 111 11 42,126 Harrison 246.0 37 5 2 15,040 Hamilton 240.9 1,969 62 15 817,473 Hancock 238.8 181 10 4 75,783 Scioto 225.7 170 10 3 75,314 Fairfield 218.9 345 25 4 157,574 County Cases per Capita Cases Hospital Admissions Deaths Population Richland 217.1 263 38 1 121,154 Ross 206.1 158 27 10 76,666 Preble 205.5 84 18 3 40,882 Muskingum 205.3 177 24 1 86,215 Seneca 201.2 111 8 1 55,178 Clermont 199.1 411 27 6 206,428 Paulding 192.8 36 5 18,672 Gallia 190.6 57 4 4 29,898 Fayette 189.3 54 9 1 28,525 Huron 185.4 108 9 58,266 Meigs 183.4 42 6 5 22,907 Adams 180.5 50 6 27,698 Marion 179.7 117 11 1 65,093 Erie 179.1 133 25 11 74,266 Portage 173.0 281 17 2 162,466 Lucas 171.8 736 36 8 428,348 Ashland 170.1 91 8 2 53,484 Williams 169.0 62 10 36,692 Noble 166.4 24 14,424 Licking 162.3 287 23 4 176,862 Perry 160.5 58 9 36,134 Brown 152.0 66 1 43,432 Summit 146.8 794 87 12 541,013 Logan 146.7 67 4 1 45,672 Stark 143.8 533 27 14 370,606 Champaign 138.9 54 4 38,885 Lake 134.3 309 21 8 230,149 Clinton 133.4 56 5 4 41,968 Cuyahoga 131.1 1,619 81 37 1,235,072 County Cases per Capita Cases Hospital Admissions Deaths Population Wayne 130.5 151 7 5 115,710 Medina 130.2 234 19 1 179,746 Crawford 130.1 54 1 2 41,494 Mahoning 117.2 268 29 4 228,683 Van Wert 116.7 33 1 1 28,275 Geauga 112.1 105 4 2 93,649 Holmes 111.5 49 4 2 43,960 Sandusky 109.4 64 8 2 58,518 Columbiana 106.0 108 11 9 101,883 Wyandot 105.6 23 1 21,772 Guernsey 105.5 41 2 1 38,875 Tuscarawas 92.4 85 13 2 91,987 Trumbull 86.4 171 14 5 197,974 Hardin 86.1 27 31,365 Highland 85.7 37 3 1 43,161 Jefferson 85.7 56 3 65,325 Morrow 82.1 29 2 35,328 Hocking 81.4 23 28,264 Carroll 70.6 19 1 26,914 Lorain 61.3 190 19 2 309,833 Knox 61.0 38 5 62,322 Washington 60.1 36 2 59,911 Ottawa 54.3 22 1 40,525 Belmont 52.2 35 1 67,006 Ashtabula 50.4 49 2 97,241 Morgan 48.2 7 1 14,508 Vinton 45.9 6 1 1 13,085 Monroe 43.9 6 1 13,654 Coshocton 30.1 11 2 1 36,600