
SLIDE 1
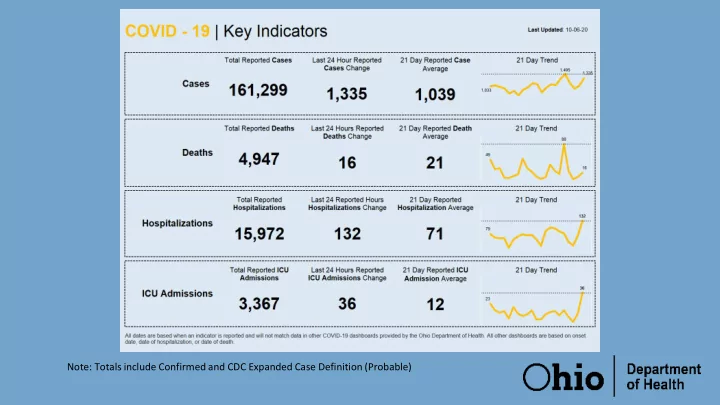
Note: Totals include Confirmed and CDC Expanded Case Definition (Probable)
Note: Totals include Confirmed and CDC Expanded Case Definition - - PowerPoint PPT Presentation
Note: Totals include Confirmed and CDC Expanded Case Definition (Probable) COVID-19 | Number of Weekly Hospital Admissions 1000 782 814 800 656 679 667 603 583 534 476 455 440 652 598 639 554 585 577 600 500 438 422 366 379 410 337 324
Note: Totals include Confirmed and CDC Expanded Case Definition (Probable)
Data as of: 10/05/2020
Data as of: 10/05/2020
1% 1% 0% 2% 2% 2% 4% 3% 2% 4% 3% 3% 2% 3% 3% 3% 2% 2% 2% 3% 4% 5% 4% 3% 2% 4% 3% 4% 3% 4% 5% 5% 7% 7% 7% 6% 9% 8% 8% 7% 5% 4% 5% 5% 4% 5% 7% 5% 4% 5% 4% 3% 4% 4% 6% 8% 8% 7% 8% 8% 7% 9% 10% 9% 11% 8% 7% 7% 8% 5% 5% 6% 5% 7% 5% 4% 4% 4% 12% 6% 9% 10% 10% 9% 12% 11% 8% 9% 10% 11% 9% 11% 10% 7% 8% 10% 10% 8% 9% 8% 8% 5% 7% 2% 16% 18% 18% 19% 16% 17% 15% 17% 18% 15% 19% 18% 17% 18% 19% 16% 15% 12% 11% 14% 13% 14% 14% 15% 12% 10% 23% 24% 23% 19% 20% 21% 18% 17% 22% 20% 18% 18% 19% 22% 22% 22% 22% 21% 20% 20% 21% 19% 19% 21% 20% 20% 22% 22% 19% 17% 18% 18% 17% 17% 20% 21% 18% 20% 19% 18% 18% 23% 20% 23% 25% 23% 22% 25% 23% 26% 28% 28% 19% 21% 22% 21% 22% 21% 19% 21% 17% 17% 13% 13% 15% 14% 16% 18% 19% 21% 22% 21% 19% 17% 21% 21% 22% 30%
21% 21% 15% 16% 19% 21% 16% 17% 16% 15% 12% 15% 16% 15% 16% 26% 29% 31% 35% 29% 32% 30% 29% 29% 36% 42% 26% 24% 21% 21% 17% 19% 22% 20% 23% 27% 25% 23% 19% 22% 24% 25% 24% 30% 24% 28% 26% 28% 31% 33% 32% 34% 54% 55% 64% 64% 64% 61% 62% 63% 61% 57% 63% 62% 65% 63% 60% 49% 47% 39% 41% 43% 42% 42% 40% 37% 33% 24%
Data as of: 10/05/2020
Urban: Cuyahoga, Franklin, Hamilton, Lucas, Montgomery, Summit Suburban/Small Metro: Allen, Butler, Clark, Clermont, Delaware, Fairfield, Greene, Lake, Licking, Lorain, Mahoning, Medina, Portage, Richland, Stark, Trumbull, Warren, Wood Rural: Adams, Ashland, Ashtabula, Athens, Auglaize, Belmont, Brown, Carroll, Champaign, Clinton, Columbiana, Coshocton, Crawford, Darke, Defiance, Erie, Fayette, Fulton, Gallia, Geauga, Guernsey, Hancock, Hardin, Harrison, Henry, Highland, Hocking, Holmes, Huron, Jackson, Jefferson, Knox, Lawrence, Logan, Madison, Marion, Meigs, Mercer, Miami, Monroe, Morgan, Morrow, Muskingum, Noble, Ottawa, Paulding, Perry, Pickaway, Pike, Preble, Putnam, Ross, Sandusky, Scioto, Seneca, Shelby, Tuscarawas, Union, Van Wert, Vinton, Washington, Wayne, Williams, Wyandot
Data as of: 10/05/2020 22% 18% 15% 12% 11% 12%7% 8%10%6% 5% 5% 8%12% 14% 14% 16% 15% 18% 16% 18% 16% 14% 18% 18% 17% 18% 18% 21% 23% 27% 30% 30% 28% 27% 23% 22% 29% 29% 27% 23% 18% 17% 17% 16% 15% 12% 12% 7% 7% 6% 5% 5% 3% 3% 4% 5% 6% 5% 8% 7% 14% 14% 10% 12% 12% 14% 11% 14% 14% 14% 16% 14% 20% 20% 20% 14% 21% 14% 22% 20% 28% 23% 22% 23% 25% 24% 22% 24% 19% 17% 20% 21% 22% 21% 17% 15% 16% 15% 15% 17% 17% 18% 14% 27% 23% 21% 17% 16% 14% 20% 15% 15% 17% 16% 14% 13% 13% 14% 16% 14% 15% 17% 17% 19% 13% 17% 18% 24% 18% 12% 14% 17% 14% 14% 14% 14% 14% 13% 16% 16% 19% 17% 13% 11% 11% 10% 13% 10% 13% 11% 14% 15% 13% 11% 10% 1% 0% 1% 1% 1% 1% 1% 1% 1% 2% 1% 2% 3% 2% 2% 5% 5% 6% 7% 6% 9% 7% 6% 4% 7% 10% 1% 2% 2% 2% 3% 1% 1% 1% 2% 1% 3% 2% 2% 2% 1% 2% 2% 3% 3% 1% 1% 2% 4% 3% 3% 5%