
SLIDE 1
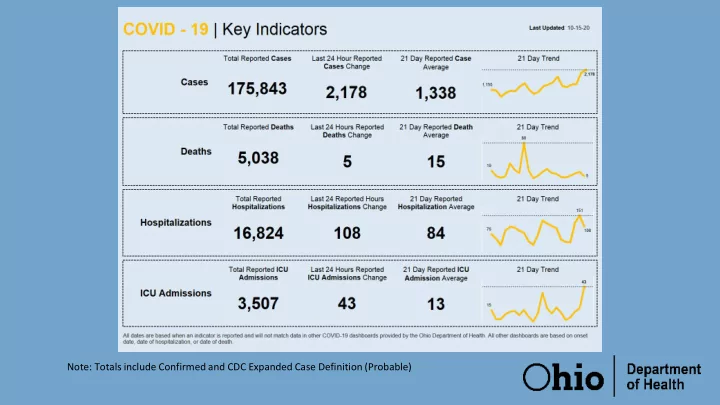
Note: Totals include Confirmed and CDC Expanded Case Definition (Probable)
Note: Totals include Confirmed and CDC Expanded Case Definition - - PowerPoint PPT Presentation
Note: Totals include Confirmed and CDC Expanded Case Definition (Probable) Alert System Level by Percentage of Ohios Population and Week 100% 5 Cty 6 Cty 6 Cty 7 Cty 9 Cty 11 Cty 10% 9 Cty 12% 13% 90% 13% 18 Cty 15% 20% 24% 11
Note: Totals include Confirmed and CDC Expanded Case Definition (Probable)
Source: Ohio Public Health Advisory System