Approaches Based on guided code generation Based on exploring - - PowerPoint PPT Presentation

approaches
SMART_READER_LITE
LIVE PREVIEW

Approaches Based on guided code generation Based on exploring - - PowerPoint PPT Presentation

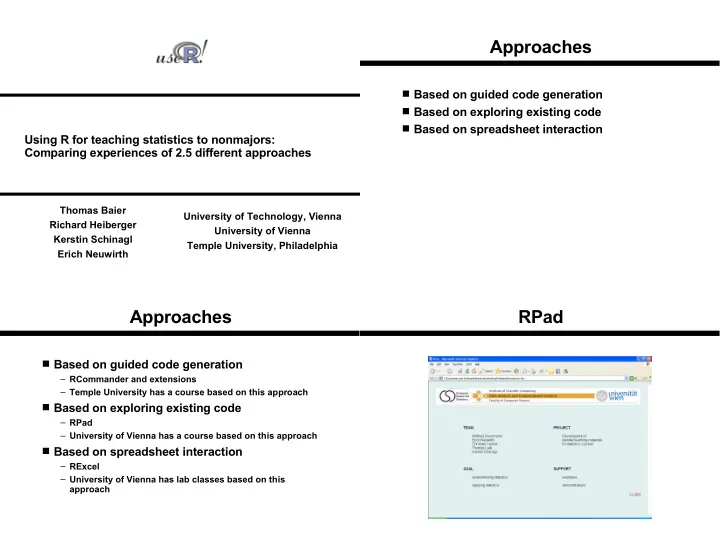
Approaches Based on guided code generation Based on exploring existing code Based on spreadsheet interaction Using R for teaching statistics to nonmajors: Comparing experiences of 2.5 different approaches Thomas Baier University of


slide-1
SLIDE 1

Using R for teaching statistics to nonmajors: Comparing experiences of 2.5 different approaches

Thomas Baier Richard Heiberger Kerstin Schinagl Erich Neuwirth University of Technology, Vienna University of Vienna Temple University, Philadelphia

Approaches

■ Based on guided code generation ■ Based on exploring existing code ■ Based on spreadsheet interaction

Approaches

■ Based on guided code generation – RCommander and extensions – Temple University has a course based on this approach ■ Based on exploring existing code – RPad – University of Vienna has a course based on this approach ■ Based on spreadsheet interaction – RExcel – University of Vienna has lab classes based on this approach

RPad

slide-2
SLIDE 2

RPad RPad RPad RPad

slide-3
SLIDE 3

RPad RPad RPad RPad

slide-4
SLIDE 4

RPad RPad RPad RExcel

■ Approach allows students to use a tool they

already know and embed advanced statistical methods in the spreadsheet paradigm

■ At the same time, prior spreadsheet

experience can help with data manipulation and graphics creation

slide-5
SLIDE 5

RExcel and RCommander

■ Temple University currently teaches an

introductory statistics course based on RCommander and RExcel.

■ Statistics with Excel always needs an addin.

We use R, the best possible addin.

■ We use the RExcel interface to get data from

Excel into R and to get tabular results back from R.

■ RCommander provides a clickable menu

interface to R.

RExcel and RCommander

■ Excel spreadsheet

containing the Prestige dataset from the car package

■ Click on the

RExcel menu item to start R

RExcel and RCommander

■ In the R GUI,

enter library(Rcmdr.HH)

■ This starts the

Rcmdr window with the HH menu

RExcel and RCommander

■ Highlight and

right click a region in Excel

■ Send the

region to RCmdr

slide-6
SLIDE 6

RExcel and RCommander

■ Click the “Statistics/Fit Models/Best Subsets Regression” menu ■ Fill in the model specification box

RExcel and RCommander

a.

Generates R script

b.

Executes R script

c.

Displays graph

d.

Identifies model with the largest adjusted R2

The model specification box

RExcel and RCommander

e.

displays the summary

  • f the

selected model

RExcel and RCommander

■ We return the regression coefficients from the selected

model back to the Excel spreadsheet.

slide-7
SLIDE 7

RExcel and RCommander

■ We return the

regression coefficients from the selected model back to the Excel spreadsheet.

RExcel and RCommander

■ Our addin to RCommander is currently

available as an R package at http:// astro.ocis.temple.edu/~rmh/Rcmdr.HH

■ Some of our additions will be included in the

next release of RCommander.

■ We thank John Fox, the developer of

RCommander, for help in designing our addins to his package.