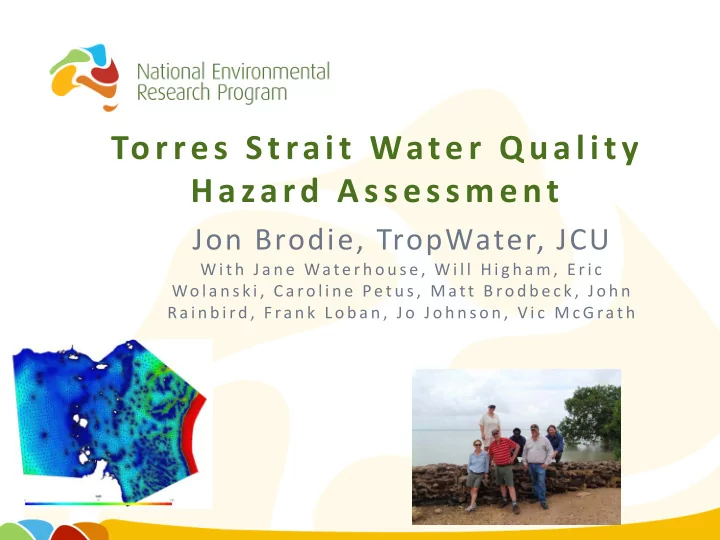

Torres Strait Water Quality Hazard Assessment Jon Brodie, TropWater, JCU Wi t h J a n e Wate r h o u se , Wi l l H i g h a m , E r i c Wo l a n s ki , C a ro l i n e Pet u s , M att B ro d b e c k , J o h n Ra i n b i rd , F ra n k L o b a n , J o J o h n s o n , V i c M c G rat h
PROJECT OBJECTIVES 1. Assess and describe all existing and potential sources of pollution to the Torres Strait marine environment. 2. Assess the hazard (and to some degree risk) of these pollutant sources to marine ecosystems & public health based on (1) and new hydrodynamic model. 3. Design a basic monitoring program which would allow reporting on the status of water quality in the Torres Strait and assessments to be made as to the success of pollution management interventions.
PROJECT ACTIVITIES 1. Review of water quality issues • Reviewed existing water quality data in the Region including historical studies. • Surveyed existing & proposed large scale development proposals. • Island inspections of STPs, Desal plants and rubbish tips with TSRA and Council staff. 2. Hydrodynamic model • Developed a hydrodynamic model in the Torres Strait region. • Validated the model and manuscript in review. 3. Remote sensing • Tested ap plication of remote sensing imagery for ongoing monitoring in the region. 4. Hazard Assessment • Prepared report and recommendations.
A general location map of the major water bodies in the region with depth in metres.
A 3-D visualization of the bathymetry in Torres Strait.
HYDRODYNAMIC MODEL • Model is up and running – manuscript of circulation patterns in review. General findings: • General movement east and north, and PNG coastal current (along the coast east to west). • Net current is unpredictable, driven by far field storms / large offshore events. • Shallow water in Torres Strait region reduces the amount of wind driven current.
Remote sensing Imagery • Established technique to distinguish cloud cover from imagery • Automated provision of imagery from NASA
PROJECT CONCLUSIONS 1) Largest threats are most likely to be associated with the potential risks from the transit of large ships through the Region. Limited and complex water exchange in and out of Torres Strait - concerns • that if Torres Strait water became polluted it would probably remain in the Strait for some time. • Ship grounding and oil spill on island/reef in TS catastrophic for small island communities. Limited response capability.
An example of AUSREP shipping reporting data, 2009. Source: DNV, 2011.
NE Australian ship traffic
Torres Strait charted two way route. Source: AMSA.
Map of the Torres Strait Particularly Sensitive Sea Area. Source: AMSA.
Prince of Wales Channel charted route. Source: AMSA.
The defined pilotage area for the Prince of Wales Channel. Source: AMSA.
PROJECT CONCLUSIONS 2) Large development in PNG including continued OK Tedi operation, gas platforms, oil palm expansion and Daru port development may also be significant . • Preliminary analysis suggest that adverse effects in the Australian part of the Torres Strait are likely to be restricted to the northern islands – Boigu, Saibai, Erub and Stephens. – Both the hydrodynamic modeling and remote sensing analysis) show that excursions of water from the Fly River drainage basin predominantly move to the east into the northern Coral Sea and along the PNG coast towards Port Moresby and are uncommon to the west of the river mouth. – The currents in this western region are generally from east to west in the central TS but a coastal current flows east to west close to the PNG coast. – However construction and operation of a major port at Daru has the potential to lead to excursions of contaminated water along the PNG SW coast
Current extent of forestry concessions in PNG. Source: Butler et al, NERP Project 11.1 unpublished data.
Location of present and proposed mining, oil and gas development in PNG. Source: Butler et al, NERP Project 11.1 unpublished data.
PROJECT CONCLUSIONS 3) Potentially localised issues with wastewater management (all marine outfalls) and general waste management exist. • Examples of remedial actions include: – STP operator training, – Annual outfall monitoring in conjunction with Rangers and assess condition, integrity. – Waste recycling at coral cays – Litter monitoring on islands adjacent to shipping route
MONITORING RECOMMENDATIONS The Basics: 1) Analysis of Remote Sensing imagery • Establishment of a historic remote sensing imagery library for the region • Assessment of plume dynamics in the Fly River during periods of discharge • Focus on turbidity • Monthly acquisition with annual assessments 2) Monitoring of marine sewage outfalls: • Structural integrity • Localised impacts – baseline and regular inspection to assess 3) Marine debris surveys: • Quantitative surveys of litter at all islands, focus on those closer to shipping route • Microplastics analysis 4) Overall reporting for monitoring program Collaboration with eAtlas •
ADDITIONAL MONITORING OPTIONS / NEEDS Additional tasks depending on management priorities and scope: 1) General / regular WQ monitoring: • In situ loggers in northern TS – in collaboration with AIMS project • Select rivers likely to be influenced by Fly River – eg. Darnley, Yorke, Murray, Saibai – and Mai Rivers eg. Boigu 2) Metals in biota Re – run assessment from 2002. Repeat study over 1 year – compare to previous • studies. Focus on northern TS. • Repeat every 5 to 10 years. 3) Oil spill risk assessment / predictions • Investigate application of SLIM model to do predictive oil spill dispersal in the region and risk assessment
THANK YOU CONTACT Name: Jon Brodie Organisation: TropWater Phone:0747816435 Email: jon.brodie@jcu.edu.au
Recommend
More recommend