Three Years After The 2011 Nourishment Project Performance, Dune - - PowerPoint PPT Presentation

three years after the 2011 nourishment project
SMART_READER_LITE
LIVE PREVIEW

Three Years After The 2011 Nourishment Project Performance, Dune - - PowerPoint PPT Presentation

TOWN OF NAGS HEAD BOARD OF COMMISSIONERS MEETING 7 JAN 2015 Three Years After The 2011 Nourishment Project Performance, Dune Growth, and Hot Spots South Nags Head 23 Dec 2014 Photo By David Ryan 2011 Nourishment The largest locally


slide-1
SLIDE 1

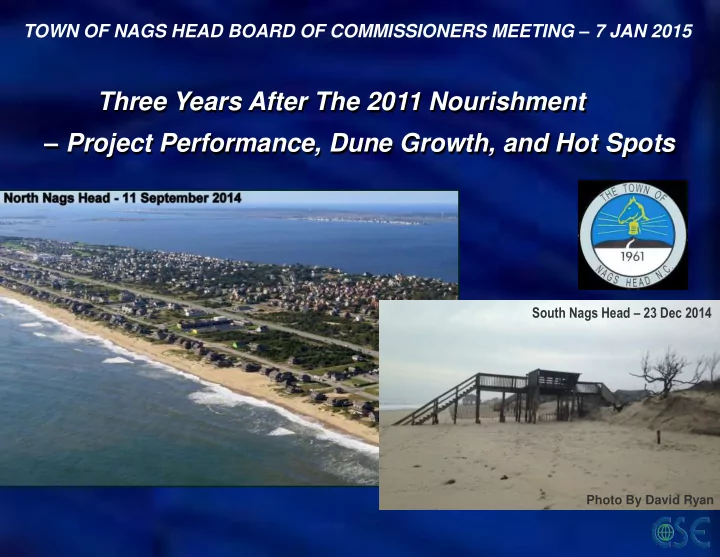
Three Years After The 2011 Nourishment – Project Performance, Dune Growth, and Hot Spots

TOWN OF NAGS HEAD BOARD OF COMMISSIONERS MEETING – 7 JAN 2015

South Nags Head – 23 Dec 2014

Photo By David Ryan

slide-2
SLIDE 2

The largest locally funded beach nourishment accomplished to date in the United States.

  • 4.6 million cubic yards
  • Along 10 miles
  • Over 100 borings to discover

pristine sand source offshore

  • Project budget of $37 million
  • Unit Price – $6.56 per cubic yard
  • 5 years of environmental reviews
  • 5 months of summer construction

between 24 May and 27 Oct 2011

2011 Nourishment

slide-3
SLIDE 3

Project Performance – Volume Changes

4.6 MCY

Dune Growth

slide-4
SLIDE 4

South NH – 2 mi ~30% loss NH R1&2 – 8 mi >10% Gain

Project Performance – Volume Changes by Reach

slide-5
SLIDE 5

Project Performance – Summary @ 3 years

  • Sediment Compaction Results
  • No different than native beaches
  • No tilling required
  • Nourishment Sand Remaining
  • Over 1 million cy more sand between dune and dry beach
  • 96% sand remaining to -19 ft NAVD (FEMA Offshore Limit)
  • North 8-mi of NH gained ~10%, south lost ~30%
  • Upcoast and Downcoast Changes
  • Upcoast gained ~230,000 cy to -19 ft NAVD
  • Downcoast gained ~170,000 cy to -19 ft NAVD
  • Biological Studies
  • CZR Study confirmed rapid recovery of organisms and no

significant differences between project areas and unnourished areas

“Wildlife thrives after Nags Head beach replenishment”

Source: Virginian-Pilot (23 Jun2014)

slide-6
SLIDE 6

Dune Management Plan – Beach Width

One-mile average dry-beach width in June 2014 between the toe

  • f dune and the edge of dry sand (between +10 and +5 ft NAVD).

Reach 1: 60-68 ft Reach 2: 83-89 ft Reach 3: 85-132 ft Reach 4: 85 ft

73.5 85.6 89.4 82.6 102.7 132.1 68.2 66.7 65.0 60.5 62.9

slide-7
SLIDE 7

Dune Management Plan – Category 1

Place sand fencing close to the stable vegetation line, and re-vegetate bare areas

slide-8
SLIDE 8

Dune Management Plan – Category 2

If the berm is >75 ft wide, place sand fencing ~25 ft seaward of the structure and promote dune buildup via fencing and vegetation.

slide-9
SLIDE 9

Dune Management Plan – Category 3

Fencing should not be installed on the seaward side unless there is >75 ft of dry-sand beach seaward of the structure.

slide-10
SLIDE 10

Erosion Hot Spots

10333 S. Old Oregon Inlet Rd. on 23 Dec 2014 (By D Ryan) 27 Oct 2014 (By C Ogburn)

  • Re-exposed sandbags
  • Dune erosion
  • Low-elevated beach

Sta 1012+00

  • E. Seagull Dr

Sta 995+00

slide-11
SLIDE 11
  • S. Nags Head on 27 Oct 2014 (By C Ogburn)
  • S. Nags Head on 31 Oct 2014 (By CSE)
  • E. Tern Street

Sta 1009+00 Reach 3/4

  • E. McCall Ct

Sta 1019+00 Reach 4

slide-12
SLIDE 12

Erosion Hot Spots – Causes

  • South Nags Head has

higher historical erosion rate than north Nags Head

  • Project End-losses
  • Profile Adjustment
  • Rhythmic Shoreline
  • Migrating versus persistent

hot spots

Recommendations

  • Additional survey in Fall 2015
  • Short-term solution (eg. sand

scraping)

  • Long-term solution (periodic re-

nourishment) – Start permitting!

  • Most cost-effective long-term

solution (combine nourishment with sand retaining structure)