theoretical biology 2016
play

Theoretical Biology 2016 Transcription factors bind DNA to block - PowerPoint PPT Presentation

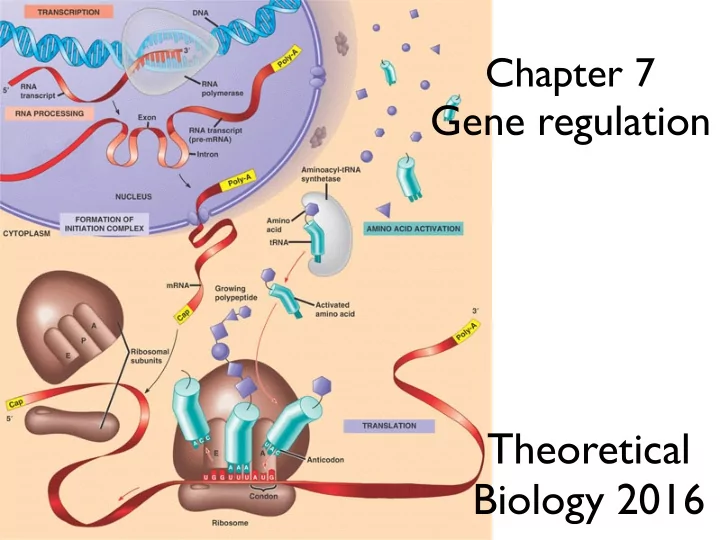
Chapter 7 Gene regulation Theoretical Biology 2016 Transcription factors bind DNA to block or enhance transcription From Campbell DNA makes RNA makes protein Golding et al. Cell 2005 d M d P d t = lM P d t = c dM and mRNA


  1. Chapter 7 Gene regulation Theoretical Biology 2016

  2. Transcription factors bind DNA to block or enhance transcription From Campbell

  3. DNA makes RNA makes protein Golding et al. Cell 2005 d M d P d t = lM − δ P d t = c − dM and

  4. mRNA formation occurs in bursts Golding et al. Cell 2005 Number of mRNA transcripts in individual cells over time. Red: data, blue: daughter cells, drops: cell division.

  5. Mathematical model: mRNA & protein Messenger M c d Protein P d M d P d t = lM − δ P d t = c − dM and

  6. Now with negative feedback on transcription c d Messenger M Protein P d M c d P d t = 1 + P/h − dM and d t = lM − δ P ,

  7. Quasi steady state assumption d M c d P d t = 1 + P/h − dM and d t = lM − δ P , Suppose turnover of protein much faster than that of mRNA d P P = l or d t = lM − δ P = 0 δ M Substituting this into d M /d t gives: d M c c d t = 1 + ( l/ δ ) M/h − dM = 1 + M/h 0 − dM with h’ = h δ /l

  8. Cross linking of receptors activates cells Mast cell degranulation B cells activate and start to divide allergen

  9. Bivalent ligand binding a monovalent receptor C : free ligand ( C > NR T ), d N d t = bN 2 C 2 R : free receptors, − dN . R T : total receptors, R T C 1 : single bound ligand, C 2 : double bound ligand: R T = R + C 1 + 2C 2 C How does C 2 , and hence the C 1 growth rate, depend on C ? C 2 R ? C 2 C

  10. R T = R + C 1 + 2 C 2 , d C 1 = 2 k on RC − k o ff C 1 − x on RC 1 + 2 x o ff C 2 , d t d C 2 = x on RC 1 − 2 x o ff C 2 . d t To study the steady state we set d C 2 / d t = 0 and add this to d C 1 / d t : d C 1 d t = 0 = 2 k on RC − k o ff C 1 = 2 KRC − C 1 , C C 1 where K = k on /k o ff and R = R T − C 1 − 2 C 2 . C 2 Solving this gives R C 1 = 2 CK ( R T − 2 C 2 ) , 1 + 2 CK

  11. − − d t C 1 = 2 CK ( R T − 2 C 2 ) d C 2 , = x on RC 1 − 2 x o ff C 2 . 1 + 2 CK d t which can be substituted into d C 2 / d t = 0 to solve C 2 as a function of C : 1 + 4 CK + 4 C 2 K 2 + 4 CKR T X − (1 + 2 CK ) q (1 + 2 CK ) 2 + 8 CKR T X C 2 = 8 CKX where X = x on /x o ff . 0.3 Thus, the number of C 2 C2 crosslinks is a bell- shaped function of the ligand concentration C. 0.15 Cells grow best at intermediate ligand concentrations d N d t = bN 2 C 2 C − dN . 0 R T -05 10 0.0001 0.001 0.01 0.1 1 10 100

  12. Lac operon, Jacob & Monod (1961) From Campbell

  13. Translate this into simple scheme Cell membrane operon: 0/1 Β -galactos. repressor permease Extra- allolactose cellular Lactose

  14. Towards a I repressor phenomenological mathematical model Repressor: R allolactose h 5 1 R = h 5 + A 5 = 1 + ( A/h ) 5 0 h allolactose : A Repressor is modeled as a declining sigmoid Hill function. We will even scale the allolactose concentration such that h= 1

  15. Complete mathematical model R : repressor, M : messenger & A : allolactose: R =0: operon “on” 1 R = 1 + A n , R =1: operon “off” cA n d M = c 0 + c (1 − R ) − dM = c 0 + 1 + A n − dM , d t d A = ML − δ A − vMA , d t c 0 : basal transcription rate, c 0 + c : transcription rate when operon is “on”, d and δ are decay rates of mRNA and allolactose, ML is the permease mediated influx - vMA term: B-galactosidase hydrolizes allolactose.

  16. Nullclines c 0 + c d A ’=0: M δ A M = L − vA Origin: M = ( δ /L)A c 0 d A M ’=0: d + ( c/d ) A n M = c 0 sigmoid Hill function 1 + A n

  17. Quasi steady state d M /d t = 0 ¯ A − − d t d A = ML − δ A − vMA d t with d + ( c/d ) A n M = c 0 1 + A n L min L max L For one concentration of L three concentrations of A

  18. Observed bi-stability in E. coli Green: E. coli with high expression of lac operon From: Ozbudak et al . Nature, 2004 (see the reader)

  19. Bi-stability in growth of E. coli The Innate Growth Bistability and Fitness Landscapes of Antibiotic-Resistant Bacteria J. Barrett Deris, 1,2 * Minsu Kim, 1 * † Zhongge Zhang, 3 Hiroyuki Okano, 1 Rutger Hermsen, 1,2 ‡ Alexander Groisman, 1 Terence Hwa 1,2,3 § Science 2013

  20. bi-stability in algal densities in lakes 2 Bistability region a Eutrophic state 1.5 P concentration Fold 2 1 Fold 1 0.5 Oligotrophic state 0 0.2 0.3 0.4 0.5 0.6 0.7 LETTER Phosphorus input rate, � doi:10.1038/nature11655 Flickering gives early warning signals of a critical transition to a eutrophic lake state Nature 2012 Rong Wang 1,2 , John A. Dearing 1 , Peter G. Langdon 1 , Enlou Zhang 2 , Xiangdong Yang 2 , Vasilis Dakos 3,4 & Marten Scheffer 3 �

  21. Initiation and termination of epileptic seizures A i B iii ii bistability ** l ** l a a t t 0 c c critical transition i i r a t r i a x p [ ] e Temporal-Corr − 2 Spatial-Corr s Frequency 10 Post-ictal Slope − 2 10mV 100ms ** increasing connectivity C D Ictal critical transition MODEL s t a b l e l . c . 1.0 1.2 Mid-seizure Pre-termination Proportion unstable l.c. p<0.005 ** Post-ictal * p<0.05 he unstable f.p. stable f.p. ** ** * 0.2 0.2 0.0 Post- Post- Ictal Ictal Pre- Pre- 3400 C 4200 Human seizures self-terminate across spatial scales PNAS: 2012 via a critical transition Mark A. Kramer a,1 , Wilson Truccolo b,c,d,e , Uri T. Eden a , Kyle Q. Lepage a , Leigh R. Hochberg c,d,e,f,g , Emad N. Eskandar f,h , Joseph R. Madsen i,j , Jong W. Lee k , Atul Maheshwari d,f , Eric Halgren l , Catherine J. Chu d,f , and Sydney S. Cash d,f

  22. Initiation and termination of depression A B D C 8 8 emotion strength emotion strength x 1 , x 2 x 1 , x 2 x 3 , x 4 x 3 , x 4 0 0 0 200 0 200 time time G E F H variance autocorrelation variance autocorrelation 0.6 0.6 1.5 1.5 x 1 (t+1) / x 1 x 1 (t+1) / x 1 SD SD AR(1)=0.38 AR(1)=0.77 0 0 0.5 0.5 x 1 x 2 x 3 x 4 x 1 x 2 x 3 x 4 0.5 1.5 0.5 1.5 x 1 (t) / x 1 x 1 (t) / x 1 correlation correlation K I J L within-valence between-valence within-valence between-valence 1.5 1.5 1.5 1.5 x 2 (t) / x 2 x 2 (t) / x 2 x 3 (t) / x 3 x 3 (t) / x 3 � =0.29 � =-0.47 � =0.69 � =-0.83 0.5 0.5 0.5 0.5 0.5 1.5 0.5 1.5 0.5 1.5 0.5 1.5 x 1 (t) / x 1 x 1 (t) / x 1 x 1 (t) / x 1 x 1 (t) / x 1 Critical slowing down as early warning for the onset and termination of depression PNAS: 2014 Ingrid A. van de Leemput a,1,2 , Marieke Wichers b,1 , Angélique O. J. Cramer c , Denny Borsboom c , Francis Tuerlinckx d , Peter Kuppens d,e , Egbert H. van Nes a , Wolfgang Viechtbauer b , Erik J. Giltay f , Steven H. Aggen g , Catherine Derom h,i , Nele Jacobs b,j , Kenneth S. Kendler g,k , Han L. J. van der Maas c , Michael C. Neale g , Frenk Peeters b , Evert Thiery l , Peter Zachar m , and Marten Scheffer a

Download Presentation
Download Policy: The content available on the website is offered to you 'AS IS' for your personal information and use only. It cannot be commercialized, licensed, or distributed on other websites without prior consent from the author. To download a presentation, simply click this link. If you encounter any difficulties during the download process, it's possible that the publisher has removed the file from their server.

Recommend


More recommend