
SLIDE 1
1
The Under Pensioned Women
Helen Lindars Equal Opportunities Commission 3rd March 2004
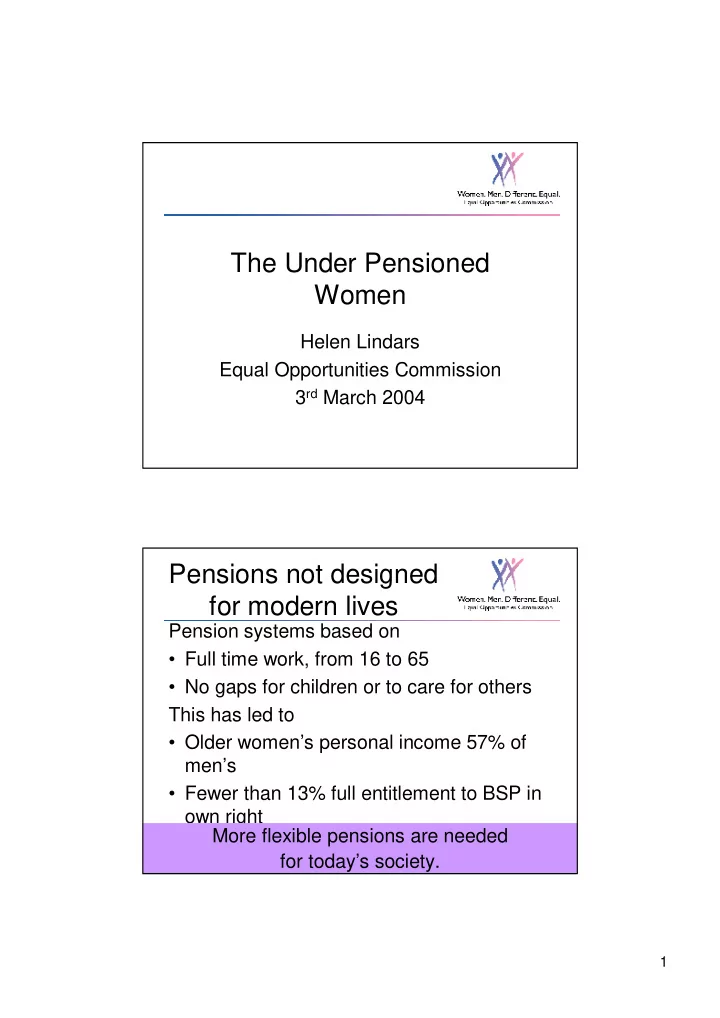
Pensions not designed for modern lives
Pension systems based on
- Full time work, from 16 to 65
- No gaps for children or to care for others
This has led to
- Older women’s personal income 57% of
men’s
- Fewer than 13% full entitlement to BSP in
- wn right