
SLIDE 1
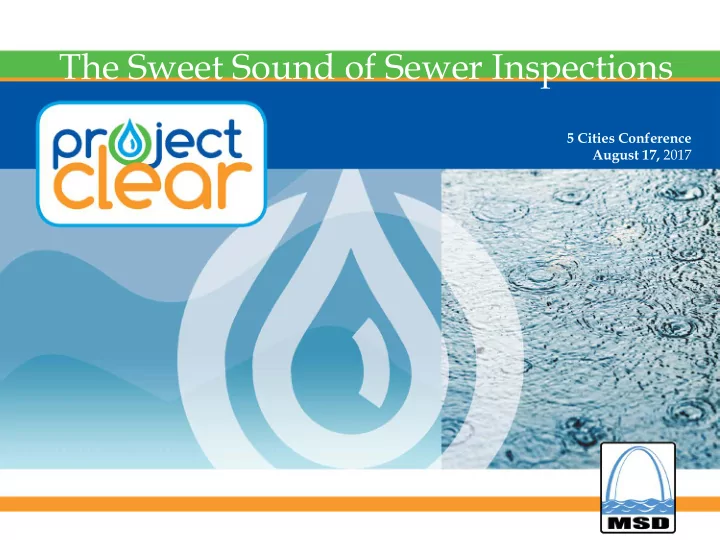
The Sweet Sound of Sewer Inspections
5 Cities Conference August 17, 2017
The Sweet Sound of Sewer Inspections 5 Cities Conference August 17, - - PowerPoint PPT Presentation
The Sweet Sound of Sewer Inspections 5 Cities Conference August 17, 2017 Presentation Goals Share results from pilot programs Detail Impact to CMOM Program and steps taken to change the program What is Acoustic Inspection? Sound Sound
5 Cities Conference August 17, 2017
3
Sound generator Sound receiver
4
5
6
Operational Divisions
Collection System divided into 5 territories supported by 3 Yards
combined sewer
Pump Stations divided into 3 territories supported by 3 divisions
Treatment Plants
7
Collection System Assets
Collection System:
8
9
10
11
12
13
14
15
September 2015 semi-annual CD meeting
# of Reaches Feet – Rating = 0 25 7,171 – Rating = 1 20 5,254 – Rating = 2 11 2,395 – Rating = 3 12 2,766 – Rating = 4 15 3,574 – Rating = 5 45 9,913 – Rating = 6 40 8,066 – Rating = 7 60 10,351 – Rating = 8 115 14,913 – Rating = 9 85 11,086 – Rating = 10 25 3,750
Rating 0-5 128 reaches 31,072’ 39.2% of total
16
17
18
19
September 2016 semi-annual CD meeting
– Fronts (1,735) – Rears (489) – Non PVC Pipe (1,718) – PVC Pipe (506)
Sewer Rating WO Count Quantity (feet) Miles Percent WO 42 12670 2.40 1.90% 1 32 9780 1.85 1.44% 2 59 16892 3.20 2.66% 3 71 19823 3.75 3.21% 4 79 22650 4.29 3.57% 5 124 33502 6.35 5.60% 18.37% 6 169 42132 7.98 7.63% 7 200 44923 8.51 9.03% 8 593 108094 20.47 26.77% 9 763 146162 27.68 34.45% 10 83 19543 3.70 3.75% 2224 476171 90.18 100.00%
20
September 2016 semi-annual CD meeting
Acoustic Rating Pipe Dia. 1 2 3 4 5 6 7 8 9 10 total 6 1 1 8 25 21 28 36 42 81 124 136 516 679 58 1746 10 1 1 4 4 6 6 7 13 17 3 62 12 13 7 23 22 18 28 21 16 32 19 10 209 15 2 7 8 14 8 17 10 23 33 7 129 16 4 1 1 1 1 2 10 18 1 3 6 10 4 24 21 1 3 1 5
21
September 2016 semi-annual CD meeting Combined
Area
Sewer Rating WO Count Quantity (feet) Miles Percent WO 23 7551 1.43 6.93% 1 11 3699 0.70 3.31% 2 33 8786 1.66 9.94% 3 35 9412 1.78 10.54% 4 41 11167 2.11 12.35% 5 51 13299 2.52 15.36% 58.43% 6 50 11042 2.09 15.06% 7 30 5829 1.10 9.04% 8 34 2912 0.55 10.24% 9 20 1909 0.36 6.02% 10 4 277 0.05 1.20% 332 75883 14.37 100.00% WO Count Non Plastic 319 Plastic 13
22
September 2016 semi-annual CD meeting
New Separate Sewer Rating WO Count Quantity (feet) Miles Percent WO 8 1767 0.33 0.76% 1 5 724 0.14 0.48% 2 3 508 0.10 0.29% 3 5 965 0.18 0.48% 4 6 977 0.19 0.57% 5 9 1964 0.37 0.86% 3.44% 6 22 3763 0.71 2.10% 7 59 11216 2.12 5.63% 8 373 66270 12.55 35.59% 9 506 98387 18.63 48.28% 10 52 12200 2.31 4.96% 1048 198741 37.64 100.00% Old Separate Sewer Rating WO Count Quantity (feet) Miles Percent WO 11 3352 0.63 1.36% 1 16 5357 1.01 1.98% 2 23 7598 1.44 2.85% 3 30 9181 1.74 3.72% 4 32 10506 1.99 3.97% 5 61 17261 3.27 7.56% 21.44% 6 93 25865 4.90 11.52% 7 108 27162 5.14 13.38% 8 184 38416 7.28 22.80% 9 222 43010 8.15 27.51% 10 27 7066 1.34 3.35% 807 194774 36.89 100.00% WO Count Non Plastic 604 Plastic 444 WO Count Non Plastic 758 Plastic 49
23
24
September 2016 semi-annual CD meeting
and a score of 0-5 indicates a sewer reach that should be cleaned
inspections with a 5 or less rating
25
September 2016 semi-annual CD meeting
Recommendations
– No changes to combined sewer program – Acoustic inspect < 15” separate sewers, 6-year cycle
– No changes for >15” or < 21” pipe
Next Steps
– Submit Formal Request
26
27
28
– 709 miles (clean approx. 20% or 140 miles)
– 20.4 miles
29
30
31
32
33
34