THE RELIABILITY-BASED PROBABILISTIC APPROACH FOR COMPOSITE TAIL - - PDF document

the reliability based probabilistic approach for
SMART_READER_LITE
LIVE PREVIEW

THE RELIABILITY-BASED PROBABILISTIC APPROACH FOR COMPOSITE TAIL - - PDF document

18 TH INTERNATIONAL CONFERENCE ON COMPOSITE MATERIALS THE RELIABILITY-BASED PROBABILISTIC APPROACH FOR COMPOSITE TAIL PLANE STRUCTURES S. Lee, I. Kim*, and Y. Choi Department of Aerospace Engineering, Chungnam National University, 220 Gung-Dong,


slide-1
SLIDE 1

18TH INTERNATIONAL CONFERENCE ON COMPOSITE MATERIALS

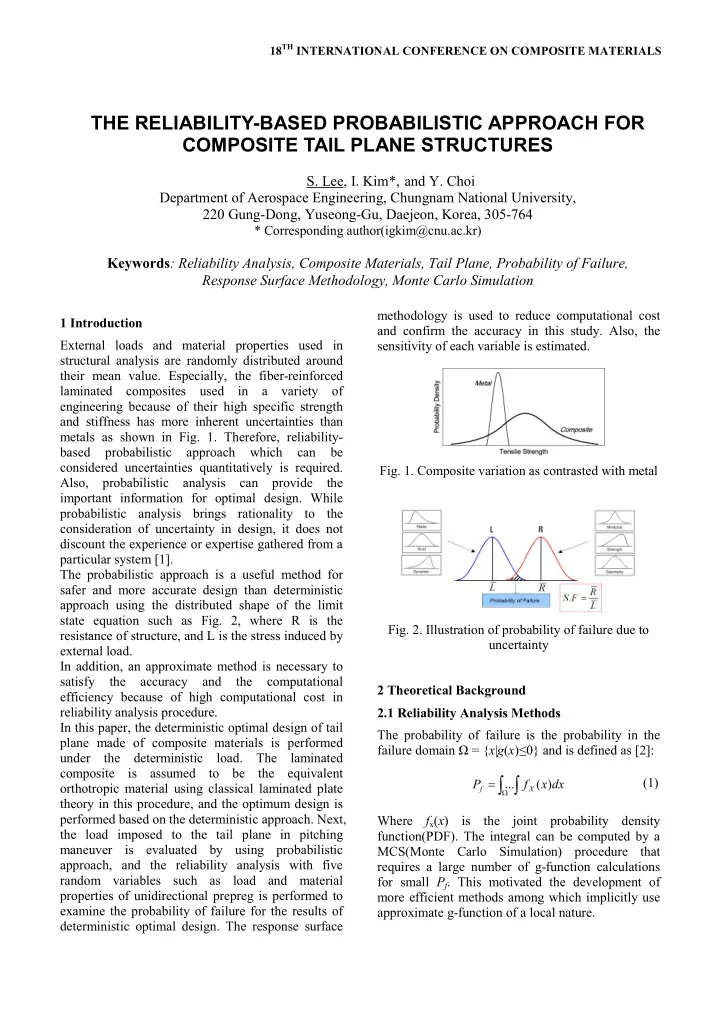
1 Introduction External loads and material properties used in structural analysis are randomly distributed around their mean value. Especially, the fiber-reinforced laminated composites used in a variety of engineering because of their high specific strength and stiffness has more inherent uncertainties than metals as shown in Fig. 1. Therefore, reliability- based probabilistic approach which can be considered uncertainties quantitatively is required. Also, probabilistic analysis can provide the important information for optimal design. While probabilistic analysis brings rationality to the consideration of uncertainty in design, it does not discount the experience or expertise gathered from a particular system [1]. The probabilistic approach is a useful method for safer and more accurate design than deterministic approach using the distributed shape of the limit state equation such as Fig. 2, where R is the resistance of structure, and L is the stress induced by external load. In addition, an approximate method is necessary to satisfy the accuracy and the computational efficiency because of high computational cost in reliability analysis procedure. In this paper, the deterministic optimal design of tail plane made of composite materials is performed under the deterministic load. The laminated composite is assumed to be the equivalent

  • rthotropic material using classical laminated plate

theory in this procedure, and the optimum design is performed based on the deterministic approach. Next, the load imposed to the tail plane in pitching maneuver is evaluated by using probabilistic approach, and the reliability analysis with five random variables such as load and material properties of unidirectional prepreg is performed to examine the probability of failure for the results of deterministic optimal design. The response surface methodology is used to reduce computational cost and confirm the accuracy in this study. Also, the sensitivity of each variable is estimated.

  • Fig. 1. Composite variation as contrasted with metal
  • Fig. 2. Illustration of probability of failure due to

uncertainty 2 Theoretical Background 2.1 Reliability Analysis Methods The probability of failure is the probability in the failure domain Ω = {x|g(x)≤0} and is defined as [2]:

ò ò

W

= dx x f P

X f

) ( ... (1) Where fx(x) is the joint probability density function(PDF). The integral can be computed by a MCS(Monte Carlo Simulation) procedure that requires a large number of g-function calculations for small Pf. This motivated the development of more efficient methods among which implicitly use approximate g-function of a local nature.

THE RELIABILITY-BASED PROBABILISTIC APPROACH FOR COMPOSITE TAIL PLANE STRUCTURES

  • S. Lee, I. Kim*, and Y. Choi

Department of Aerospace Engineering, Chungnam National University, 220 Gung-Dong, Yuseong-Gu, Daejeon, Korea, 305-764

* Corresponding author(igkim@cnu.ac.kr)

Keywords: Reliability Analysis, Composite Materials, Tail Plane, Probability of Failure, Response Surface Methodology, Monte Carlo Simulation

slide-2
SLIDE 2

The key to efficient methods is the ability to identify where in the input space the approximation should be made in order to capture the most critical region that has a high failure probability density. One approach to identify an approximation point is by first transforming the original random variable space to independent normalized space and then identifying the MPP(Most Probable Point) as the approximation point, as illustrated in Fig. 3. In the transformed u-space, MPP is the minimum distance point from the origin to the g(u)=0 surface. The minimum distance β is called the reliability index. The MPP usually can be found using standard

  • ptimization procedures by solving

Minimize |u| subject to g(u)=0 The AFOSM(Advanced First Order Second Moment method) solution is usually referring to using a linear approximation in the u-space and it can be shown that the corresponding exact Pf is Pf = Φ(-β) (2)

  • Fig. 3. Illustration of most probable point

2.2 Response Surface Methodology RSM(Response Surface Methodology) is a collection of statistical and mathematical techniques useful for developing, improving and optimizing processes [3]. The most extensive applications of RSM are in the particular situations where several input variables potentially influence some performance measure or quality characteristic

  • f

the process. Thus performance measure or quality characteristics are called the response. The input variables are sometimes called independent variables, and they are subject to the control of the scientist or engineer. The field of response surface methodology consists

  • f the experimental strategy for exploring the space
  • f the process or independent variables, empirical

statistical modeling to develop an appropriate approximating relationship between the yield and the process variables, and optimization methods for finding the values of the process variables that produce desirable values of the response. In general, the relationship is y = f(ξ1, ξ2, …, ξk) + ε (3) where the form of the true response function f is unknown and perhaps very complicated, and ε is a term that represents other sources of variability not accounted for in f. Usually ε includes effects such as measurement error on the response, background noise, the effect of other variables and so on. Usually ε is treated as a statistical error, often assuming it to have a normal distribution with mean zero and variance σ2. Then E(y)=η=E[f(ξ1, ξ2, …, ξk)]+E(ε)=f(ξ1, ξ2, …, ξk) (4) 3 Numerical Example Example model used in this paper is a Cranfield A1- 100 aircraft developed in 1990 as shown in Fig. 4 [4]. The tail plane such as cantilever box beam has two spars: front spar is located at 15% of chord line and rear spar is at control surface. The ribs in parallel line of flight path are arranged as shown in Fig. 5. The skin and spar are made of unidirectional graphite/epoxy prepreg(USN150), and stacking sequence is [0/+45/-45/90]s. This is simplified to the equivalent orthotropic material. The airfoil section is similar to wing box comprised of upper skin, lower skin, spar and rib with considering structural

  • function. The distributed load is applied to top

surface uniformly.

  • Fig. 4. Cranfield A1-100 aerobatic aircraft
  • Fig. 5. Dimensions of wing box
slide-3
SLIDE 3

THE RELIABILITY-BASED PROBABILISTIC APPROACH FOR COMPOSITE TAIL PLANE STRUCTURES 3

4 Optimal Design and Reliability Analysis 4.1 Result of Optimal Design The optimal design in this study is to minimize the total weight of the wing box treating the thickness of each element as a design variable. The only constraint is a limit on the maximum displacement

  • f the wing box. A lower and upper bound are

specified on each thickness. Wtotal is a total weight, ti is a thickness of element, δmax is a maximum displacement and NE is a number of element group. The Problem is: Minimize Wtotal Subject to δmax ≤ 5mm 1mm ≤ ti ≤ 10mm i = 1, … , NE The result of optimal design using the SQP method is indicated in Table 1. The composite materials is compared with metal, aluminum 2024-T3. As a result, overall thickness of composite materials is thicker than that of metal because it has a low elastic modulus relatively, but composite materials is lighter than metal. Table 1. Result of optimal design Composite Materials Metal Rib 1 (mm) 1.03 1.01 Rib 2 (mm) 1.00 1.00 Spar 1 (mm) 1.56 1.19 Spar 2 (mm) 1.27 1.08 Upper skin 1 (mm) 2.90 1.74 Upper skin 2 (mm) 1.69 1.19 Lower skin 1 (mm) 2.88 1.65 Lowe skin 2 (mm) 1.67 1.16 Spar cap (mm) 1.90 1.09 Weight (kg) 6.22 7.95 4.2 Result of Reliability Analysis In the reliability analysis, we use the finite element analysis S/W(COMSOL) and MATLAB interface, and the form of response surface model is as follows, where b is coefficient of response surface model, xi is random variable and n is number of random

  • variable. This model represents the structure

response of the optimized tail plane [5].

å

=

+ =

n i i ix

b b F I Type

1

ˆ :

å å å å

  • =

= + = =

+ + + =

1 1 1 2 1 1

ˆ :

n i n i i ii n i j j i ij n i i i

x b x x b x b b F II Type

The reliability analysis methods used in this study are MCS and AFOSM, and random variables are E1, E2, ν12, G12 and load. Properties of each random variable are described in Table 2 [6,7]. The number

  • f sample points is 243 using design of experiment

that is D-optimal method provided in MATLAB

  • toolbox. Adjusted coefficient of determination(Radj

2)

is used to verify the suitability of response surface

  • model. Also, sensitivity of each variable is estimated

to provide the effective information to designers. The reliability analysis procedure is shown in Fig. 6. Table 2. Random variables Mean COV Distribution E1 (GPa) 131 0.046 Normal E2 (GPa) 8.2 0.040 ν12 0.28 0.031 G12 (GPa) 4.5 0.060 Load (N) 4191 0.026

  • Fig. 6. Reliability analysis flowchart(MCS)

4.2.1 Probability of Failure The probability of failure is calculated in the displacement requirement of the composite materials. In this instance, the limit state equation(g) is as below. g = 5mm - δmax(E1, E2, ν12, G12, Load) (5) The structure is regarded as fail when the value of limit state equation is less than zero. The accuracy and computational time are compared between the finite element analysis and response surface

  • methodology. The reliability analysis methods used

in this paper are MCS and AFOSM. When the

slide-4
SLIDE 4

reliability analysis is conducted by using the MCS, the probability of failure and suitability of response surface model are evaluated. This method provides the basis to verify the accuracy in wide region of limit state equation because it reflects the characteristics of distribution of random variables. If the AFOSM is used, the probability of failure, MPP coordinates and reliability index are evaluated. This method provides the bases to verify the accuracy in the region of MPP, but an error will be increased if the limit state equation has high nonlinearity. The probability of failure for the deterministic

  • ptimal design results are shown in Table 3-5. The

full model means that approximation technique is not used but only FEA using COMSOL. The probability of failure is about 50%. There are nearly no differences between results by two reliability analysis methods. We can confirm that deterministic

  • ptimal design can give no guarantee about structure

safety in case of reflecting uncertainties of random variables. The distribution of limit state equation is illustrated in Fig. 7-8. As previously stated, maximum displacement is determined as failure criteria, the relative area over the 5mm is the probability of failure. Using the RSM, probability of failure has a good agreement with the full model, and computational time is reduced considerably. The suitability of all types of response surface model is fully accurate. Table 3. Probability of failure using MCS (full model) Full model Method MCS Pf (%) 47.9± 3.16* Computational time (hour) 25 * 95% confidence interval Table 4. Probability of failure using MCS (response surface model) Type I Type II Method MCS MCS Pf (%) 49.7± 3.16* 50.0± 3.16* Computational time (hour) 6 6 Suitability (Radj

2)

0.9976 0.9911

* 95% confidence interval

Table 5. Probability of failure using AFOSM (response surface model) Type I Type II Method AFOSM AFOSM Pf (%) 48.7 46.8 β 3.31e-2 7.91e-2

  • Fig. 7. Distribution of limit state equation

(full model and type I)

  • Fig. 8. Distribution of limit state equation

(full model and type II) 4.2.2 Sensitivity The probability sensitivity coefficient is related to the reliability-based design applications, based on the concept of the MPP of failure, as illustrated in

  • Fig. 9 [8]. By projecting the β vector onto each

dimension of the random design space, such as u1 and u2, the components along each dimension normalized by β provide sensitivity indicators of the reliability with respect to random variables, as shown in equation 6, where y is a random performance, ϕ(•) is the PDF of the standard normal distribution, h(•) is the PDF of a random variable, xi. ui is the standard normal random variable transformed from xi. Si is the directional cosine in the gradient of the limit state at the MPP.

slide-5
SLIDE 5

THE RELIABILITY-BASED PROBABILISTIC APPROACH FOR COMPOSITE TAIL PLANE STRUCTURES 5

2 2 1 2 2

) ( ) ( ) ( ) ( ) ( b f f

MPP i MPP n j j j j i i i i

u x h u x y x h u x y S = ÷ ÷ ø ö ç ç è æ ¶ ¶ ÷ ÷ ø ö ç ç è æ ¶ ¶ =

å

=

(6) As a result of the sensitivity analysis as shown Table 6, E1 has the highest sensitivity among random variables.

  • Fig. 9. Illustration of the MPP-based sensitivity

measures Table 6. Probability of failure using AFOSM RSM-Type I RSM-Type II E1 7.00e-1 7.03e-1 E2 1.76e-3 1.82e-3 ν12 5.33e-6 3.38e-6 G12 2.80e-3 2.92e-3 Load 2.95e-1 2.92e-1 5 Conclusions The concluding remarks

  • f

this paper are summarized as follows. (1) The deterministic optimal design for the tail plane with both composite materials and metal is conducted and its structural weight is reduced when the composite materials are used. (2) The probability of failure is calculated under the same condition as optimal design constraint by using reliability analysis such as MCS and AFOSM. The calculated probability of failure distribution can be used to estimate the probability density function which is necessary to the reliability-based design

  • ptimization.

(3) The sensitivity of each random variable is

  • calculated. The dominant variable that affect to the

displacement by external load is E1. The provided results in this paper can be used in reliable improved design and developing computationally inexpensive models to solve reliability-based design

  • ptimization

problem. Furthermore, we could adopt the importance sampling method that combines the MPP-based approximation methods and Monte Carlo simulation by taking MC samples only in the vicinity of MPP to compute reliability analysis effectively. References

[1] A. Haldar and S. Mahadevan “Reliability assessment using stochastic finite element analysis”. John Wiley & Sons, Inc., 2000. [2] Y. Shin and Y-T Wu “Progressive importance sampling approach for reliability analysis”. AIAA, 2006. [3] R. H. Myers and D. C. Montgomery “Response surface methodology: process and product

  • ptimization using designed experiment”. A Wiley-

Interscience Publication, 2002. [4] D. Howe “Aircraft loading and structural layout”. AIAA education series, pp 475-494, 2004. [5] S. Lee and I. Kim “Reliability analysis for composite laminated plate using hybrid response surface method”. Journal of the Korean Society for Composite Materials, Vol. 23, No. 2, pp 40-47, 2010. [6] Y. Choi, I. Kim and S. Lee “Probabilistic load analysis for tailplane considering uncertainties in design variables”. Journal of the Korea Institute of Military Science and Technology, Vol. 13, No. 6, pp 1043-1050, 2010. [7] H. K. Jeong and R. A. Shenoi “Probabilistic strength analysis of rectangular FRP plates using Monte Carlo simulation”. Computers and Structures 76, pp 219- 235, 2000. [8] H. Liu and W. Chen “Probabilistic sensitivity analysis methods for design under uncertainty”. AIAA, 2004.