SLIDE 1 The Political Economy
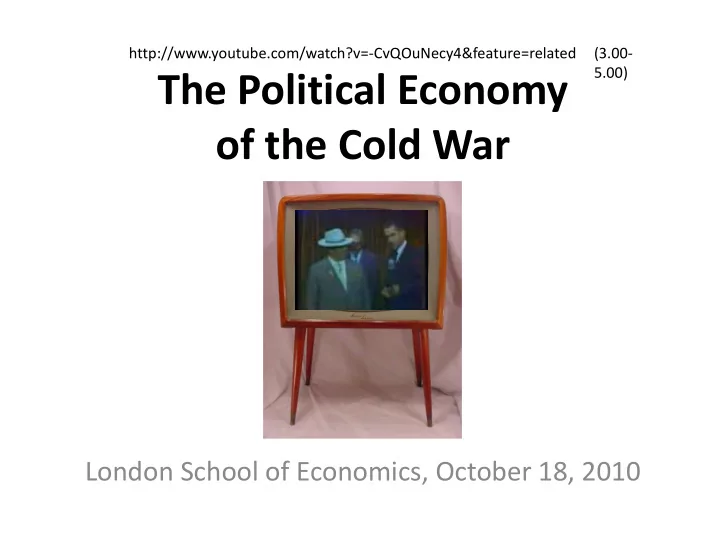
http://www.youtube.com/watch?v=-CvQOuNecy4&feature=related (3.00- 5.00)
London School of Economics, October 18, 2010
SLIDE 2 A foregone conclusion?
Nixon and Khrushchev in the kitchen, Moscow 1959
SLIDE 3
A foregone conclusion?
SLIDE 4 A foregone conclusion?
Jules Régis Debray, French leftist philosopher and comrade in arms of Che Guevara: There is “more power in rock music and blue jeans than the entire Red Army”
SLIDE 5
A foregone conclusion?
SLIDE 6 11/9/1989: The scoop that never was
Checkpoint Charlie: The crossing-point from West to East Berlin
SLIDE 7
The scoop that never was
SLIDE 8 A foregone conclusion?
Growth rate declined Total factor productivity (TFP) declined
Raw materials worth more than finished products
Price controls blocked market signals (as Hayek Corruption—the ‘grabbing hand’ (Shleifer)
Officials have an interest in restricting output
‘You pretend to pay us and we pretend to work.’
No incentives in the
Price controls blocked market signals (as Hayek had warned)
Steel consumption/GDP ratio 4 times as high as in the United States
Only oil price hike kept show going
Armageddon Averted (Kotkin) No incentives in the workplace
Excess defence spending Inadequate allowances for depreciation of capital stock
Chernobyl, April 16, 1986
Ill health and alcoholism
17 litres a year …
SLIDE 9 Source: HBS Case 795-060 TFP = Total Factor Productivity
SLIDE 10 Source: Maddison, World Economy
SLIDE 11 Source: HBS Case 795-060
SLIDE 12 The sad truth
Soviet GDP was not 49%
(CIA), more like 36% (European Comparison Project) Project) In 1945 it had been 27% Soviet per capita consumption was not 31% of US level, more like 24% In other words, Turkey – Bergson (1997)
SLIDE 13
SLIDE 15 Source: Maddison, World Economy
SLIDE 16 Source: World Bank, WDI
SLIDE 17
What I used to think: The Eurocentric narrative The Eurocentric narrative
SLIDE 18
Europe’s predicament in 1947
Population up 10%, despite death toll of war Industrial production down 40% Reduction of overseas Reduction of overseas invisible earnings and worsening terms of trade reduce capacity to import by 40%
SLIDE 20
./ ,)0
(' # 1' #2 32 2 ('2 40""5+ 6"2 7"2 8'"52
SLIDE 21 The traditional answer: Marshall’s Plan
‘Europe … must have substantial additional help
- r face economic, social, and political
deterioration of a very grave character.’ – at Harvard, June 5, 1947
SLIDE 22
Causes of the post-war ‘miracles’
SLIDE 23
7"'
# # ('
,)0 *+ ,) ./ 33"9 #".,,6 .,
Source: Maddison, World Economy
SLIDE 24
Marshall Aid
Around 2.5% of recipient GDP For each $1 of aid some 65 cents went to increased consumption and 35 cents to increased investment An extra $1 of investment raised national product by 50 cents in the subsequent year cents in the subsequent year Helped finance early trade deficits
American sponsorship of trade liberalization ‘Americanization’ of business
‘Taylorist’ management, U.S. marketing techniques
Sustained American military expenditures
SLIDE 25 /*01!',
;- ; ;- ; ;-
Total aid 1946-52 equivalent to 1.1 per cent of US GDP; but biggest recipients not best performers
<
"
)
(
$
"
SLIDE 26
Those who started from lowest base generally had highest growth
Spain, Portugal, Germany, Italy, Austria
Abundant labour (refugees) plus wartime investment
- in capital stock gave Germans an advantage
Reduction of class conflict compared with 1920s— the success of ‘corporatism’ (Maier)
Unemployment down from 10% (1950) to 1% (1960) Lower labour radicalism, e.g. Germany
SLIDE 27
SLIDE 28 (a) Social and Christian Democracy
‘Scarcely anyone doubts that we must move towards socialism’ (Hayek)
Planning as legacy of war economy
France: Monnet’s Plan— dirigisme West Germany: Erhard’s social market economy’
Stable currency
economy
Britain’s welfare state
20% of productive capacity nationalized Welfare “from cradle to grave” Healthcare free at point of delivery
Stable currency Free trade Deregulation
Italy: Church, industry plus Mafia
The ‘honored society’ in Sicily
SLIDE 29 2#!")+ .'.,
#
- NB Not including education
and housing
SLIDE 30 (b) Versus ‘real existing socialism’
Soviet exactions: c. $14 bn. Five and Six Year Plans
Heavy industry and urbanization
Collectivization Collectivization
- Esp. Baltic states, Romania
Forced labor
Danube-Black Sea Canal Bulgaria 100,000 slaves, 361,000 workers
The ‘New Class’ (Milovan Djilas)
SLIDE 31
Catch: The West’s slide into ‘stagflation’
SLIDE 32 Source: Maddison, World Economy
SLIDE 33 Source: Maddison, World Economy
SLIDE 36 Source: Global Financial Data
SLIDE 37 Source: Nationwide
SLIDE 38
What I think now: East Asia as the key East Asia as the key
SLIDE 39 The view from the East
West European success was not the surprise of the post-war period Asian growth was much more remarkable We need to give more The Soviets fared much better in Latin America and Africa, where economic performance deteriorated (Westad, Mitrokhin) We need to give more weight to American
South Korea Also Hong Kong, Malaysia, Singapore, Taiwan and even Indonesia Mitrokhin) South Vietnam: exception that proves the rule The decisive year was not 1989 but 1979 … when China joined the Asian bandwagon
SLIDE 40 Asian share from 14% to 34% … … W European down from 36% to 22%, N American from 44% to 26% Source: Bridgewater
SLIDE 41 Source: World Bank, WDI
SLIDE 43 Source: World Bank, WDI
SLIDE 44
SLIDE 45
Understanding Asian success
Long-term security guarantees vital after military interventions (especially Japan, Korea, Taiwan) Increasingly open economic order upheld by the United States principally benefited Asian countries Taiwan) Post-war reforms created secure institutional basis for growth – especially land reform (Japan 1946) Asian countries They were able to export their way to prosperity thanks to American FDI plus American consumption
SLIDE 46 A problem for liberals
A series of military interventions and
successful: Japan, Korea, Malaya (UK), Philippines Economic success in Asia was not a function of democratic institutions* But it was followed by democratic transitions Malaya (UK), Philippines South Vietnam was the exception that proved the rule (In a counterfactual world, South Korea 2.0) democratic transitions Success was not based on standard market models … but it benefited from liberalize global trade regime
E.g. Generals Park Chung-hee (1960-79) and Chun Doo-hwan (1980-87) in South Korea … also Lee Kuan Yew in Singapore, Suharto in Indonesia 1-party states in Taiwan and Japan.
SLIDE 47
Yet ex post interventions were worse
‘Successes’ Iran (1953) Guatemala (1954) Congo (1961) ‘Failures’ Indonesia (1957) Cuba (1959) South Vietnam (1964- Congo (1961) Brazil (1964) Dominican Republic (1965) Chile (1973) South Vietnam (1964- 1975) Angola (1975-76) Ethiopia (1977) Afghanistan (1979)
SLIDE 48
The counterfactual question
Would the United States have won the Cold War if East Asia had not experienced an economic miracle? Weren’t the Soviets better positioned to win Weren’t the Soviets better positioned to win …
SLIDE 49
24 November 2010
The Third World’s War