SLIDE 4 1.
ings fr from UK econome metric ric time series models ls ca can be s sum umma maris ised d by: Qt = Q Q0 (1 (1+g.
t ) (1+p.
t ) Et
where 𝒉 ≅ 𝒒 ≅ 1
ated d econome metric ric est stimat ates by Veruete-McKay ay et. al
1) used to ge generat ate our indica cative ive E-index ndex, , where Et
t ≅ (1+T1 1 )
) n1t (1+T2
2 )
) n2t
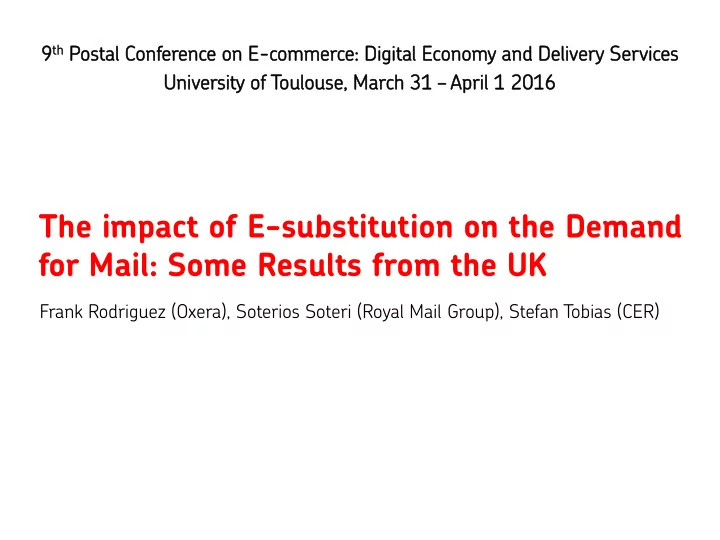
2 4 6 8 (%) per annum Letter volume growth Economic growth and demographic growth
Source: EMRF using data from Office for National Statistics, Experian and Royal Mail Finance. Note: Data in chart refer to two year moving
- averages. This excludes D2D, PFW and all International traffic. Letter volume growth reported outturns from 2006/07; prior to 2006/07 the
series has been grown in line with the total addressed inland mail traffic series which contains a small proportion of parcels
Esub, (TW) Note data refers to two year moving averages. Letter traffic refers to addressed inland traffic.
Econometric estimates for UK letter demand and e-substitution
E-inde ndex = 1 in 2001 an and < 1 therea eafter er Econometric estimates suggest: 𝑈 1 ≅ -3% and 𝑈 2 ≅ -6%
𝐹𝑢 = (1 - proportionate loss to e-substitution relative to 2001)
E-ind ndex
Economic growth plus number
Letter volume growth Source: Royal Mail Group and Office for National Statistics
4