
SLIDE 1
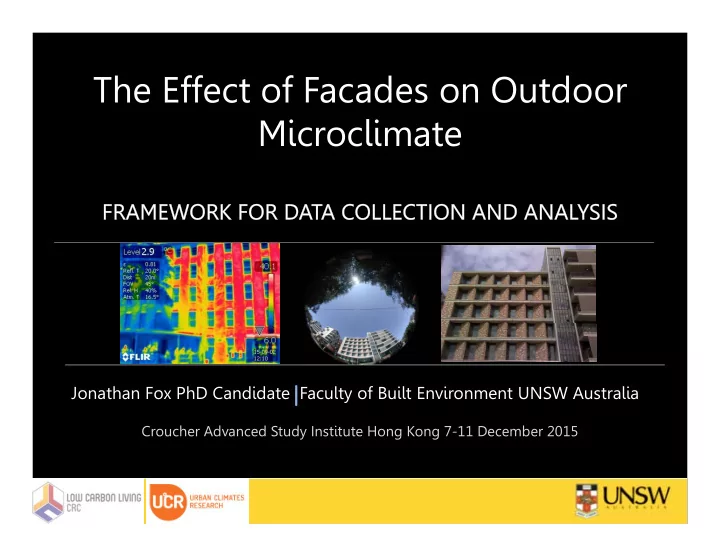
The Effect of Facades on Outdoor Microclimate
Jonathan Fox PhD Candidate Faculty of Built Environment UNSW Australia
Croucher Advanced Study Institute Hong Kong 7-11 December 2015
The Effect of Facades on Outdoor Microclimate Jonathan Fox PhD - - PowerPoint PPT Presentation
The Effect of Facades on Outdoor Microclimate Jonathan Fox PhD Candidate Faculty of Built Environment UNSW Australia Croucher Advanced Study Institute Hong Kong 7-11 December 2015 Research Context 2887 heatwave deaths in Australian cities
Jonathan Fox PhD Candidate Faculty of Built Environment UNSW Australia
Croucher Advanced Study Institute Hong Kong 7-11 December 2015
2014: 54% 3.9 billion 2050: 66% 6.3 billion
Quantifying the impact of climate change on extreme heat in Australia by Will Steffen (Climate Council of Australia). 2015
heatwave deaths in Australian cities 1890 - 2013
current and projected 2050 Australian urban population. Projected Sydney population in April 2016
current and projected 2055 Australian population over 85yo; projected % over 65yo and % 65yo living in cities
2014: 54% 3.9 billion 2050: 66% 6.3 billion
Variables Platform Sensors and Instruments Local meteorological parameters
Thermal
Spectral albedo
Green: 0.63 - 0.69μm; NIR 0.76 - 0.90μm)
ABS Nearmap 17 November 2015
H:17.5 W:21 H:24.5 W:18
C1 C2
LCZ 2 Compact Midrise LCZ 4 Open highrsie Ultimo Zetland
H/W:1.3 H/W:0.8
ABS 2013
2014: 54% 3.9 billion 2050: 66% 6.3 billion Workflow Methods
Photogrammetry
ArcGIS (ArcMap)
analysis Spatial Analyst Tool
Spatial Modeling and linear regression
Georeferenced base plan . shp file
2014: 54% 3.9 billion 2050: 66% 6.3 billion
Ground albedo 0.136 av Wall surface temperature 28oC av Ground surface temperature 29.32oC av 19.11.2015 9:45‐10:05am KENSINGTON, NSW,‐33:54:16, ‐151:12:50 10am ‐ AZI:63o 10am ‐ ALT:63o
Thank you!
www.sbe2016sydney.org