
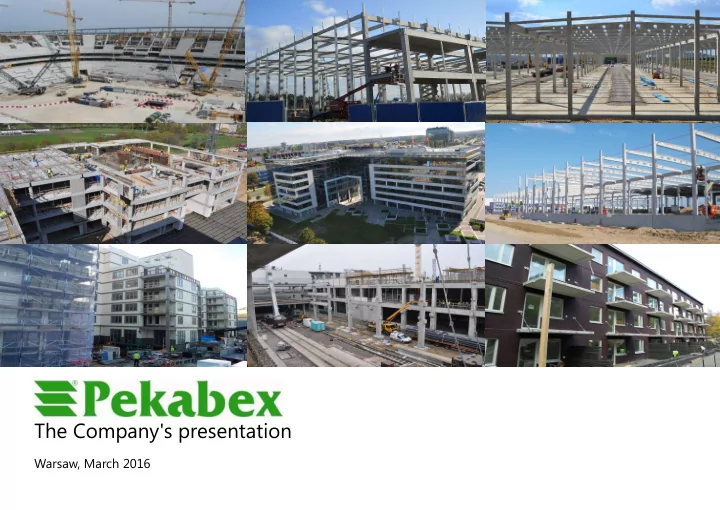
SLIDE 1
The Company's presentation
Warsaw, March 2016
The Company's presentation Warsaw, March 2016 Key figures 227,541 - - PowerPoint PPT Presentation
The Company's presentation Warsaw, March 2016 Key figures 227,541 K PLN #1 4 about 1000 plants manufacturing value of the order Leader of the market of reinforced concrete people working portfolio 2 reinforced concrete prefabricated
Warsaw, March 2016
Key figures
#1
Leader of the market of reinforced concrete prefabricated elements in Poland
net debt in 20156
about 1000
people working in the Capital Group1
4
plants manufacturing reinforced concrete prefabricated elements (Poznań, Bielsko Biała, Gdańsk, Mszczonów)
227,541 K PLN
value of the order portfolio2 as on 31 Dec 2015
29,853 K PLN
adjusted3
EBITDA in 2015
35,759 K PLN
EBITDA in 20154
(1) Including cooperating ones, as on 31 Dec 2015 (2) It refers to contract orders for prefabricated elements and construction services (3) EBITDA - operating profit increased by depreciation and reduced by profit from an occasional purchase in the amount of 5,906 K PLN (4) EBITDA - operating profit increased by depreciation (5) Net profit reduced by net profit from an occasional purchase (6) Net debt means a difference between interest-bearing debt (loans and leasing) and cash and cash equivalents
17,747 K PLN
adjusted5 net profit in 2015 22,531 K PLN
net profit in 2015
350,396 K PLN
sales revenues in 2015
Very good results in 2015
(1) Gross sales profitability defined as gross profit from sales divided by sales revenues (2) EBITDA profitability as the sum of operating profit and depreciation divided by sales revenues (3) Operating profitability as the quotient of operating profit and sales revenues (4) Net sales profitability as net profit divided by sales revenues
328 233 350 396 15,9% 17,7% 2014 2015
Sales revenues, gross sales profitability(1)
(thousand PLN, %)
15 850 17 747 22 531 4,8% 5,1% 2014 2015 adjusted 2015
Net profit, net sales profitability(4)
(thousand PLN, %)
23 838 29 853 35 759 7,3% 8,5% 2014 2015 adjusted 2015
EBITDA, EBITDA profitability(2)
(thousand PLN, %)
19 751 23 057 28 963 6,0% 6,6% 2014 2015 adjusted 2015
Operating profit,
(thousand PLN, %)
Very good results in 2015
(1) Net debt is a difference between the total debt ratio and cash and its equivalents (2) EBITDA adjusted - operating profit increased by depreciation and reduced by profit from an occasional purchase
2014 2015
Net debt(1)
(thousand PLN)
14 560 9 821 23 838 29 853 2014 2015 Net cash from operations EBITDA adjusted
Cash flow from operations(2)
(thousand PLN)
Fixed assets
(thousand PLN)
110 869 174 426 2014 2015 128 137 177 330 2014 2015
Equity
(thousand PLN)
Sales revenues
Sales revenues per segment*
(thousand PLN)
* In 2014, revenues not assigned to the segments were not taken into consideration. 2014 – 2015
190 763 67 779 43 467 19 560 321 570 237 558 77 943 32 929 5 822 354 251
Contracts - prefab elements Contracts - construction services Manufacturing services The other Total
A considerable decrease in ‘The other’ segment results mainly from transactions excluded from consolidation due to incorporating CNP into the Group. In 2014, the sales of raw materials and materials to CNP was a significant element of this segment.
2014 2015 2014 2015 2014 2015 2014 2015 2014 2015 + 10.2%
+ 14.9% + 24.5%
Operating results per segment
27 803 37 137 5 628 2 552 1 154 Contracts - prefab elements Contracts - construction services Manufacturing services The other Total
Segment operating result, segment operating result profitability(1)
(thousand PLN, %)
2015
11,7% 7,2% 7,7% 19,8% 10,5%
(1) Segment operating result profitability calculated as the quotient of the segment operating result and the segment sales revenue
20 515 31 505 1 572 4 295 5 124 Contracts - prefab elements Contracts - construction services Manufacturing services The other Total 10,8% 2,3% 9,9% 26,2% 9,8%
2014
Sales revenues
2014 – 2015 Sales revenues per geographic area*
(thousand PLN)
245 319 40 806 35 445 321 570 264 331 56 767 33 153 Poland Scandinavia Germany Total + 7.7 % + 39.1%
+ 10.2% 354 251 2014 2015 2014 2015 2014 2015 2014 2015
* In 2014, revenues not assigned to the segments were not taken into consideration.
Selected stock exchange indices
12,36% 12,70% 2014 2015 6,20% 7,07% 2014 2015
ROE index(1)
(%)
ROA index(2)
(%)
(1) The index calculated as the ratio of net profit to equity (2) The index calculated as the ratio of net profit to the sum of assets
A consistent production growth
40,5 44,9 45,2 57,6 55,6 4,6 7,4 13,7 12,3 8,8 0,0 20,0 40,0 60,0 80,0 100,0 2011 2012 2013 2014 2015
Production (thousand m3) – the Pekabex Group
Poznań Bielsko-Biała Gdańsk
(thousand m3)
52.6 76.7 71.3 49.5 40.5
* Until 2014 – production for the Pekabex Group together with CNP
Selected essential contracts completed in 2016
‘Nytt Barnsjukhus- Göteborg-Sweden’
The contract value:
32,200 K PLN ‘Lech Świątek’
The contract value:
13,920 K PLN ‘Branddörren- Stockholm-Sweden’
The contract value:
15,770 K PLN ‘Twardogóra Production and Assembly Hall’
The contract value:
11,435 K PLN ‘Garnison Helikopterhangar Ronneby-Sweden’
The contract value:
15,770 K PLN ‘Furiren- Stockholm-Sweden’
The contract value:
16,112 K PLN
The large order portfolio
108 93 140
179 49
31.12.2012 31.12.2013 31.12.2014 31.12.2015
Contract sales to be carried out next year Contract sales to be carried out in 2017-2018
228
Value of the order portfolio – including solely contract sales1
(million PLN)
1 – It takes into account contract sales: segments: contract execution – prefabricated elements and contract execution – construction services
unforeseeable events that could affect the execution of this contract.
Selected essential contracts signed in 2016
The Framework Agreement with Veidekke Entreprenab AB
The estimated value of future orders to be executed in 2016–2018
118,000 K PLN ‘Olivia 5 – annex’
The contract value:
69,627 K PLN
(increasing the contract value by 52,478 K PLN)
‘Kv Kvarnbacken Norrköping- Sweden’
The contract value:
54,236 K PLN
Purchasing a plant in Mszczonów
(15 Jan 2016)
Subject of purchase:
Manufacturing plant in the Mszczonów district near Warsaw
Net selling price:
(increased by the net value of stocks: 4,429,119.16 PLN)