
SLIDE 1
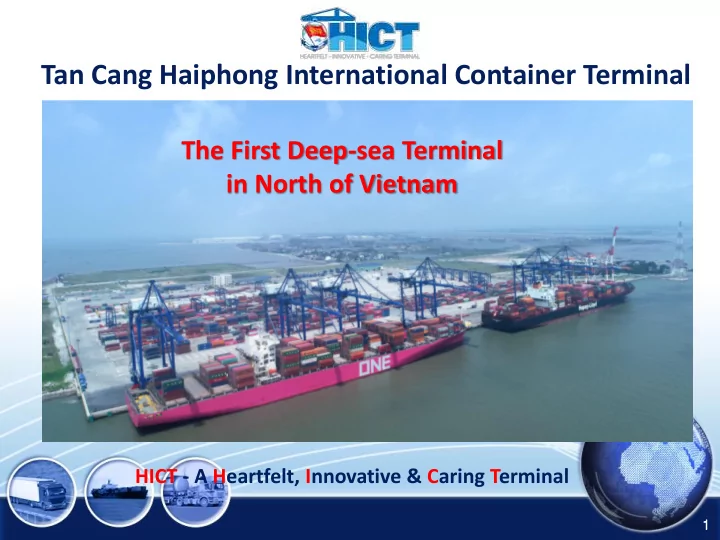
Tan Cang Haiphong International Container Terminal
1
Tan Cang Haiphong International Container Terminal The First - - PowerPoint PPT Presentation
Tan Cang Haiphong International Container Terminal The First Deep-sea Terminal in North of Vietnam HICT - A Heartfelt, Innovative & Caring Terminal 1 Lo Loca cation tion & & Acc Access R ess Roa oads ds 10 Major IZ 5 BAC
1
12 22 5 15 19 21 32 39 45 42 13 14 16 17 18 20 9 2 3 4 6 7 37 8 1 10 33 35 36 38 34 40 41 44 23 24 25 26 27 29 28 30 31 11 46
Cai Lan HAI PHONG
43 NH5
Major IZ Other IZ Planned IZ
47 48 49
Interchange
Hanoi – Haiphong Expressway NH5B
NH18
Hanoi–Haiphong Road No. 5
HA NOI BAC NINH HUNG YEN QUANG NINH HAI DUONG
2 Sept 2018
3
Nam Hai Transvina Green Port Doan Xa Chua Ve
Tan Cang 128
Hai An
Tan Cang 189
PTSC Dinh Vu Tan Vu Dinh Vu Nam Hai - Dinh Vu VIP Green Nam Dinh Vu Mipec
SNP (3 terminals) GMD (3 terminals) VICONSHIP (3 terminals) VINALINES (4 terminals) Others
No. Terminal Throughput 2019 (TEU) Market share 2019 (%) 1 Tân Vũ 991,852 19.16% 2 VIP Green 639,351 12.35% 3 Đình Vũ 540,261 10.44% 4 Nam Hải - Đình Vũ 444,794 8.59% 5 TC-HICT 419,351 8.09% 6 PTSC 350,195 6.76% 7 Nam Đình Vũ 328,592 6.35% 8 Hải An 315,310 6.09% 9 Chùa Vẽ 301,980 5.83% 10 Green Port 283,659 5.48% 11 TC - 128 269,571 5.21% 12 Nam Hải 142,875 2.76% 13 TC - 189 106,237 2.05% 14 Đoạn Xá 34,779 0.67% 15 Transvina 8,645 0.17% TOTAL 5,133,150 100%
The 2019 container throughput by terminal in Haiphong
Unit: 1,000 TEU Source: VPA, SNP June 20 5
2,000 3,000 4,000 5,000 6,000
2012 2013 2014 2015 2016 2017 2018 2019
241 116 53 2 3 68 110 56
2,594 3,042 3,438 3,914 4,141 4,455 4,954 5,133
Hai Phong Cai Lan
Unit: 1,000 TEU Unit: 1,000 TEU
Breakwater & Sand Protection Dyke Tan Vu – Lach Huyen Bridge & Access Road (toll free) Land Reclamation, Soil Improvement, Retaining Wall, Public Berth, etc.
June 20 6
Construction Item Contractor Completion
(4.50km+5.44km+5.69km = 15.63km) SMCC-Local JV 2/Sep/2017
& Turning Basin (Φ660m, -14.0m) Toyo Construction, Penta-Rinkai JV 7/Aug/2018
(7.6km) Toa Construction Nov/2019
container yard, gate, workshop, office, etc. Selected by HICT Jul-2018 Remarks: 1-5 above are public work items supported by Japanese ODA loans, while the terminal facility is constructed by HICT under the first large scale Public-Private-Partnership project between the two Governments of Vietnam and Japan.
June 20 7
In
Breakwater Channel Dredging Equipment Road & Bridge
Yard pavement
Land reclamation & Soil improvement
Area Development: reclamation, retaining wall, public berth; Channel dredging, Breakwater& Sand Protection Dyke)
(berths total 750m, container yard, gate, handling equipment, workshop, office)
History 2011 Established, 1st Certificate of Incorporation was issued 2014 Vietnamese Investor replaced from VINALINES to SNP 2016 Ground-Breaking Ceremony - 12th May Terminal construction started WHL officially joined 2018 HICT Grand Opening - 13th May
Cur urrent ent In Inves esto tors
51.0% 15.0% 17.5% 16.5%
June 20 9
① Mai ain Berth 750m x x 50m D-16m 16m ② Bar arge Berth 150m x x 30m D D-5m 5m ③ Contai ainer Storag age Area (1) Dry y (Green:22 lanes)
s)
(2) Reefer (Violet
let:2 lanes) s)
(3) Empty (Brown
wn:4 lanes) s)
④ STS C Cran ane x 6 6 u units ⑤ eRTG TG x 2 24 u units ⑥ Car argo Inspection Area ⑦ Equipment Workshop ⑧ Contai ainer M&R shop ⑨ Tr Truck G Gat ate ⑩ Offic ice & Can anteen
① ② ③
(1)
④ ⑤ ⑥ ⑦ ⑨ ⑧ ⑩
Public Area
From Dinh Vu
⑤ ⑤ ⑤ ⑤ ⑤ ⑤ ⑤ ⑤ ⑤ ⑤ ⑤ ⑤ ⑤ ⑤ ⑤ ⑤ ⑤ ⑤ ⑤ ⑤ ⑤ ⑤ ⑤ ④ ④ ④ ④ ④ ③
(2)
③
(3 )
③
(1)
③
(3 )
June 20 10
Buoy No. Zero
Content Main Berth L750m* W50m D -13.4m Barge Berth L150m W30m D -5m Container Yard
Ship to Shore Crane 6 units: outreach 65m, height above rail 46m Yard Transfer Crane
(Rubber-Tired Gantry Crane)
ERTG x 24 Container Handling Equipment Tractor & Cassis x 30 sets, Reach Stacker x1, Top Lift x1 Backup Generator 2000kva x (2 ) Truck Gate 14 Lanes (In 8 + Out 4), Weighing Scale x 3
June 20 13
No. Items
River Terminals
HICT Note I Facility 1 Channel Depth
2 Berth Front Depth
*-14.5m in Jul 2020
3 Turning Basin Diameter 250-350m 660m II Ship to Shore Crane 4 Outreach < 40m 65m 5 Lifting height above rail < 36m 46m 6 Lifting capacity 50MT 65MT 2x20’ twin III Vessel Operation 6 Largest size < 2,000 TEU 12,000 TEU 7 Navigational condition Restricted by tide almost all cases Tide effects in case actual draft >13m 8 Loadable cargo volume less than full load up to full load IV Service Route 9 Direct long haul trades unavailable available save lead time 5 to 7 days
14
3. Real-time Container Location Report
Hand-held, DGPS 1. Auto Planning of Shipside & Container Yard 2. Container Handling Equipment Assignment E-PORT ❑ Integrated to e-Customs (Declaration via Internet, Submission of Manifest by EDI) ❑ Linked with X-ray container scanner for the Customs inspection ❑ Link with e-banking ❑ 100%
procedure through EPORT for both inbound & outbound containers
TOPS (Terminal Operations Package System) architected by RBS, Australia
June 20 15
16
Easy way to check cargo info and status
An electronic information portal developed by TCIS Electronic registration, payment and invoice *ePORT application interface
17
18
19
Specification No. Tug Break Horsepower Bullard Pull 1 TC10 1,200 BHP 2 Azimuth TCA8 3,350 BHP 41 Tons 3 Azimuth TCA18 3,600 BHP 45 Tons 4 Azimuth TC62 4,000 BHP 5 Azimuth TC86 5,600 BHP
June 20 20
X-ray ay Scr Screening V eening Vehic ehicle le ♦ high-energy mobile scanners designed for non- intrusive inspection of cargo ♦ can be used in various inspection sites, where total cargo inspection is required without
the containers
Year Container River Terminals HICT Price difference Non-ePORT user ePORT user ePort vs non- ePort user HICT ePort vs River terminals 2020 20’ laden 561,000 VND 400,000 VND 280,000 VND
(- 5.2 USD)
(- 12.0 USD) 40’ laden 759,000 VND 540,000 VND 378,000 VND
(- 7.0 USD)
(- 16.3USD)
10
22
No. Terminal 20' laden 40' laden Price (VAT included) % difference TC-HICT vs River terminals Price (VAT included) % difference TC-HICT vs River terminals 1 TC-HICT 280,000 378,000 2 Nam Hải 528,000
726,000
3 Green Port 616,000
836,000
4 Chùa Vẽ 528,000
726,000
5 Tân Cảng 128 561,000
759,000
6 Hải An 583,000
803,000
7 Tân Cảng 189 616,000
836,000
8 PTSC Đình Vũ 616,000
836,000
9 Tân Vũ 616,000
836,000
10 Đình Vũ 616,000
836,000
11 Nam Hải Đình Vũ 616,000
836,000
12 VIP green Port 616,000
836,000
13 Nam Đình Vũ Port 594,000
792,000
Average 592,167
804,833
Unit: VND
Berth No.1 & 2
750m VINFAST
“DEEP C” Haiphong III
Original Image: Revised Master Plan of Lach Huyen Port Project authorized by Peoples’ Committee of Hai Phong City in Jun-2016 June 20 23
Effective FTAs
AFTA
ASEAN
Since 1993 ACFTA
ASEAN, China
Since 2003 Since 2007 AKFTA
ASEAN, Korea
Since 2008 AJCEP
ASEAN, Japan
Since 2010 AIFTA
ASEAN, India
Since 2010 AANZFTA
ASEAN, Australia, New Zealand
Since 2014 VCFTA
Vietnam Chile
Since 2015 VKFTA
Việt Nam, Hàn Quốc
Since 2016 VN – EAEU FTA
Vietnam, Russia, Belarus, Amenia, Kazakhstan, Kyrgyzstan
Since 2009 VJEPA
Vietnam Japan
03 FTAs under negotiation
Vietnam– Israel FTA
Vietnam, Israel
Dec/2015 RCEP
ASEAN, China, Korea, Japan, India, Australia, New Zealand
Mar2013 Vietnam – EFTA FTA
Vietnam, EFTA (Switzerland, Norway Iceland, Liechtenstein)
May2012 Dec 2018 CPTPP
Vietnam, Canada, Mexico, Peru, Chile, New Zealand, Australia, Japan, Singapore, Brunei, Malaysia
AHKFTA
ASEAN, Hongkong
11Jun2019 EVFTA
Vietnam, EU (28 menbers)
30Jun/2019
13 FTAs signed
Source: Center for WTO and Economic Integration
NORTHWES T NORTHEAST RED RIVER DELTA NORTH CENTRAL
Ha Noi
Quang Ninh Hung Yen Ha Nam
Tan Cang – Dong Van Ha Nam ICD
Hai Duong
Tan Cang – 128 & 189 Terminals
Bac Ninh
Tan Cang – Hai Phong ICD
Hai Phong
Hanoi Haiphong Express way NH5 NH18
Tan Cang – Que Vo ICD
Thai Binh
Distance between major IZ and HICT Ha Noi : 130-170 km Bac Ninh: 125-143 km Ha Nam: 122-139 km Hung Yen: 118-140 km
June 20 26
Feeder Terminal in Hai Phong
June 20 27
28
Samsung Electronics Samsung Display Cannon Foxconn Vina Solar JASolar
Tan Cang - Bac Ninh ICD ⇔ HICT Distance via Inland Waterway: 115 km Berth depth: - 5m Transport time: 9 hours Routing: Duong river (3km) ⇔ Kinh Thay river (50km) ⇔ Cam river (30km) ⇔ Bach Dang river (11km) ⇔ Ha Nam channel (21km) ⇔ HICT
Factory Distance to ICD Samsung Display 34 km Samsung Electronics 32.8km Cannon 16.7km Foxconn BN 16.2 km Vina Solar 26.6 km JA Solar 30.3 km ICD TAN CANG QUE VO
Waterway route Trucking route
Item Tan Cang – Hai Phong ICD Tan Cang – Que Vo ICD Tan Cang – Dong Van Ha Nam ICD Location Dinh Vu IZ Chau Phong IZ
Close to NH1A & Phap Van-Cau Gie- Ninh Binh highway
Total Area 30 ha 27 ha 10 ha Annual Capacity 800,000 TEU 400,000 TEU 150,000 TEU Quay Length n/a 360 m (03 berths) n/a Warehouse To be built 6,000 m2 CFS To be built Facility n/a
3 fixed cranes, 2 reachstackers, 2 RTGs, 72 reefer plugs, 20 trucks
n/a Advantage Close to river terminals Able to receive 160TEU barge Ready to Operate Already 3Q2020 Already
June 20 29
31
Sun Mon Tue Wed Thu Fri Sat 5 1 4 6 2 2 3 3
No Service Operator Port Rotation
1 SE1
(Double-call at HP)
MAERSK TCHICT-HCMC-SIN-TJP-SHV-LCB-SIN 2 NV1/CVX/NV1
(Double-call at HP)
MAERSK/ YML/TSL Loop 1: TCHICT- Ningbo- Shanghai- Hongkong Loop 2: TCHICT- Qindao- Shanghai- Hongkong 3 ORCHID MSC
N.Bound: SIN-TCHICT-Qinzhou-Yantian-HKG-Qindao-Fuzhou-Shantou-HKG- Shekou S.Bound: Shekou-TCHICT-Tanjong Pelepas-SIN 4 FIVE/NIX/ CIX3/AIS3/CIVS PEL/KMTC/ ZIM/EMC/ESL TCHICT-QINDAO-SHA-NBO-DCB-PKL-NAV-MUN-HAZ-CLB-PKL-SIN 5 CI3/FCE/ FCS2/CCX WHL/COSCO/ OOCL/ONE TCHICT-SHA-NGB-HKG-SHK-SIN-PKL-MAA-KAT-PKL-SIN 6 PN2 ONE/YML/HLC TCHICT-Yantian-Tacoma-Vancouver-Kaohsiung-SIN-Laem Chabang-TCIT 7 PS3 ONE/YML/HLC Nhava Sheva– Pipavav- CLB- PKL- SIN- LCB- TCIT- TCHICT- Long beach- Oakland- Pusan- SHA- Ningbo- Shekou- SIN- PKL- Nhava Sheva 8 AACI COSCO Lianyungang– SHA– Ningbo– Shekou-Nansha– SIN- PKL- Nhava Sheva– Karachi– CLB- LCB– TCHICT- SHA- Ningbo- Long Beach- Seattle- Lianyungang
32
Vietnam’s GDP growth in the past 10 years
33
Unit: Billion USD
34
AREA EXPORT 2019 IMPORT 2019
Turnover (Bil USD) Compared to 2018 (%) Ratio (%) Turnover (Bil USD) Compared to 2018 (%) Ratio (%)
1) ASIA
135,45 2,9 51,3 202,90 6,6 80,2
24,96 1,3 9,4 32,09 0,9 12,7
41,41 0,1 15,7 75,45 15,2 29,8
20,41 8,4 7,7 19,53 2,5 7,7
19,72 8,1 7,5 46,93
18,5
2) EURoPE
47,27 2,0 17,9 18,63 4,9 7,4
41,48
15,7 14,91 7,4 5,9
3) Australia
4,46
1,7 5,14 16,4 2,0
4) AMERICA
73,89 27,3 28,0 22,46 10,6 8,9
61,35 29,1 23,2 14,37 12,7 5,7
5) AFRICA
3,12 8,1 1,2 3,95
1,6
TOTAL 264,19 8,4 100,0 253,07 6,8 100,0
Export & Import turnover of Vietnam by continent, country in 2019
35
Top 10 Major exported commodities of Vietnam in 2019
51.38 35.93 32.85 18.32 18.3 16.91 10.65 8.51 8.54 4.2
10 20 30 40 50 60 Unit: Billion USD
36
Top 10 Major imported commodities
51.36 36.75 24.13 15.53 14.62 10.55 9.51 5.95
10 20 30 40 50 60
Computers, electronics, accessories Machinery, equipment, tools and spareparts Raw materials for textiles, leather and footwear Raw plastic and plastic products Phones and accessories Chemistry and products All kind of steel and iron Fuel
Unit: Billion USD
No Province Import/Export 2019 Import/Export 2018 % (+/-)
1
Bắc Cạn 9,930,901 7,101,942 39.8%
2
Bắc Giang 14,424,181,218 11,131,648,436 29.6%
3
Bắc Ninh 62,103,751,928 66,510,206,119
4
Cao Bằng 50,184,815 89,210,827
5
Hà Giang 174,188,570 106,757,445 63.2%
6
Hà Nam 4,931,380,177 4,236,943,215 16.4%
7
Hà Nội 47,383,198,403 44,887,746,437 5.6%
8
Hà Tĩnh 3,285,250,515 3,Z084,424,044 6.5%
9
Hải Dương 14,287,492,626 13,045,169,083 9.5%
10
Hải Phòng 27,929,032,535 22,303,210,775 25.2%
11
Hòa Bình 961,824,743 892,019,300 7.8%
12
Hưng Yên 7,264,010,056 7,004,101,300 3.7%
13
Lai Châu 26,873,893 15,533,741 73.0%
14
Lạng Sơn 1,785,112,168 1,911,783,854
15
Lào Cai 1,328,167,898 1,222,188,015 8.7%
16
Nam Định 3,143,286,932 2,705,666,152 16.2%
17
Nghệ An 1,569,896,558 1,401,053,203 12.1%
18
Ninh Bình 4,595,440,098 3,183,707,214 44.3%
19
Phú Thọ 4,331,987,345 2,969,588,585 45.9%
20
Quảng Ninh 5,019,892,616 4,462,674,613 12.5%
21
Sơn La 43,008,701 54,119,043
22
Thái Bình 3,170,372,842 2,958,305,955 7.2%
23
Thái Nguyên 43,392,779,509 39,262,838,510 10.5%
24
Thanh Hóa 8,346,746,463 6,486,798,642 28.7%
25
Tuyên Quang 157,614,261 138,526,304 13.8%
26
Vĩnh Phúc 11,599,492,355 9,005,129,424 28.8%
27
Yên Bái 307,096,451 276,103,910 11.2% TOTAL 271,622,194,577 249,352,556,088 8.9%
37
Import Export Turnover by Province in Northern Vietnam in 2019
Unit: USD
June 20 38